

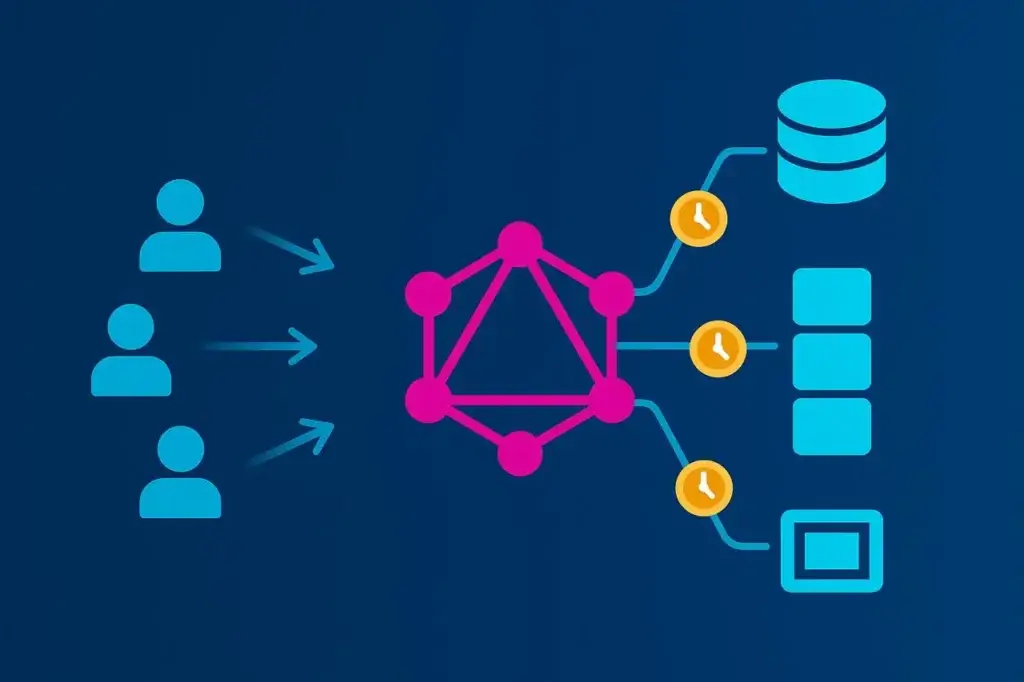
GraphQL changed how frontends consume data, and in doing so, it changed how APIs fail under pressure.
Unlike REST, where each route usually defines what data returns, GraphQL gives more control to the client. The client decides what fields to fetch, how deep to traverse, and how often to repeat the request. That flexibility is useful for developers, but it makes performance harder to predict. Two queries against the same endpoint can generate very different server workloads.
Traditional load testing assumes consistency: a fixed path, predictable payload, and measurable latency. GraphQL breaks those assumptions. To test it effectively, you have to model query variance, resolver depth, authentication, caching, and concurrency patterns that reflect real-world use. Otherwise, you may only be testing your cache or one narrow query path, not the full GraphQL API.
This article breaks down how to design, execute, and interpret load tests that capture what actually matters in a GraphQL system: resolver cost, backend orchestration, query complexity, and the tradeoff between flexibility and scalability.
Why GraphQL Load Testing Is Different
Most load tests are built on repetition. You record one API transaction and replay it at scale, measuring how long it takes to complete. That works reasonably well for many REST endpoints. A call like /api/orders often returns a predictable payload, exercises similar logic, and costs about the same in compute each time.
GraphQL works differently because each client request defines its own workload:
- Some queries fetch one or two fields.
- Others go several layers deep into nested relationships.
- Some requests include mutations, fragments, aliases, or multiple operations.
To the load generator, it may all look like a single POST /graphql request. Beneath the surface, your servers might be making dozens of database queries, fanning out to several microservices, checking permissions, and serializing hundreds of JSON fields.
That’s why GraphQL load testing should not be treated as a simple throughput test. It is not only about how many requests per second the endpoint can handle. It is about how query shape drives backend behavior. The right approach means designing tests that reflect that variability instead of hiding it.
The Hidden Cost of Query Complexity
One of GraphQL’s most misunderstood characteristics is how expensive it can become with depth. A seemingly harmless query can turn into a major backend workload once it expands through nested resolvers.
Take a basic e-commerce schema:
query GetCustomer {
  customer(id: "42") {
    name
    orders {
      id
      total
      products {
        id
        name
        price
      }
    }
  }
}
On paper, that looks simple. But if every resolver calls a database separately, one for the customer, one for each order, and one per product, you have multiplied the backend work. The well-known “N+1 problem” can turn a single client request into a swarm of downstream calls.
Now imagine 1,000 virtual users hitting that query in parallel. You are not load testing one endpoint anymore. You are load testing every database table, resolver, cache, and microservice downstream. The challenge is not just concurrency. It is understanding where that concurrency actually shows up.
To make load testing meaningful, you need visibility at the resolver level. Query depth, resolver count, downstream calls, and query complexity should be part of your testing profile, not just response time. Otherwise, you will only see the symptom, not the cause.
What to Measure and Why
Performance metrics for GraphQL should be viewed in layers: query, resolver, and system. Each tells a different part of the story.
At the query layer, focus on:
- Latency Distributions: p50, p95, and p99 response times show how complex queries affect tail performance.
- Throughput: Queries per second can be useful as context, but it should not be the only goal.
- Error and Timeout Rates: These help catch load-induced degradation, rejected queries, and failed downstream calls.
- Query Complexity Scores: These help show whether expensive query shapes are driving performance issues.
At the resolver layer, collect instrumentation data wherever possible:
- Execution time per resolver or field.
- Number of resolver invocations per query.
- Cache hit and miss ratios.
- Downstream call latency for databases, services, and external APIs.
- DataLoader batching behavior, where applicable.
At the system layer, tie those metrics back to infrastructure utilization, including CPU, memory, thread count, connection pools, database performance, and network usage. GraphQL servers can become CPU-bound during load spikes due to query parsing, validation, resolver execution, and response serialization, so the bottleneck may not always live in the database.
Raw response times alone will not tell you enough. Correlating resolver execution with infrastructure telemetry is how you isolate true scalability constraints.
Building a Realistic GraphQL Load Model
GraphQL is not a single API. It is an interface for many different operations. To test it realistically, you have to reflect that diversity.
Start by mining production traffic or access logs for operation names and query signatures. These reveal the actual mix of client behavior, including short lookups, deep aggregations, mutations, dashboard requests, mobile app queries, and occasionally abusive “fetch everything” queries.
From there:
- Weight Queries by Frequency: Your test mix should mirror production proportions, such as 80% lightweight lookups and 20% complex nested queries.
- Randomize Variable Values: Use realistic IDs, filters, and pagination values so caching layers do not make the test look better than production.
- Include Authentication Flows: Token generation, session validation, permissions, and rate limiting can all become choke points under load.
- Include Mutations: Reads are not the whole story. Mutations such as checkout, account updates, uploads, and form submissions may create database locks, queues, or downstream side effects.
- Model Concurrency Patterns: Real users do not arrive evenly. Simulate bursts, ramp-ups, and idle valleys to see how autoscaling, caching, and rate limits behave.
A load test that only replays one query is like a stress test that only hits your homepage. It may look fine until real-world traffic shows up. The more representative your workload, the more useful your data.
Executing GraphQL Load Tests
Load testing GraphQL effectively means layering realism and scale. The API’s flexibility demands both controlled, script-based tests and distributed runs that simulate real user conditions across regions.
Scripted HTTP-Based Testing
JMeter remains a useful foundation for GraphQL load testing. Since GraphQL commonly operates over HTTP POST requests, you can define queries as JSON payloads, inject variables dynamically, and parameterize tokens or session data within a JMeter test plan.
This approach gives control over concurrency, headers, payload structure, and variables. It is useful for validating backend performance under realistic query mixes. It is lightweight and repeatable, but it only tells part of the story: response time at the protocol level. It does not account for browser behavior, frontend rendering, or the full user journey.
Scaling GraphQL Tests with LoadView
To move from local or smaller scripted runs to production-scale validation, LoadView can provide a managed execution layer for distributed testing. It can run JMeter scripts across multiple geographic locations, introducing real-world latency and network variability that local environments cannot simulate.
LoadView extends the same scripting flexibility while helping with orchestration:
- Import existing JMeter plans.
- Run GraphQL POST requests with dynamic variables and authentication tokens.
- Execute concurrent users across global regions for more realistic performance data.
- Visualize latency percentiles, throughput, and error trends.
This hybrid approach, using JMeter for test definition and LoadView for distributed execution, offers both precision and scale. Teams can iterate during development, then validate at higher load before release using the same test logic.
Browser-Level Load Testing
When GraphQL powers user-facing frontends, it is worth validating how performance feels at the browser layer. LoadView can execute browser-based scenarios that render pages and trigger GraphQL requests through real browsers. This measures complete transaction times, including rendering, network delays, JavaScript execution, caching behavior, and client-side API timing.
Used together, these layers, scripted HTTP testing and browser-level execution, create a more realistic model of how GraphQL performs when many users are querying, navigating, and interacting at the same time.
Avoiding the Classic Testing Pitfalls
GraphQL performance testing is full of traps that can make data misleading. The worst part is that many of them look like success until production proves otherwise.
One frequent mistake is testing a single static query. It gives clean, consistent numbers but tells you little about how the system handles query diversity.
Another is ignoring cache state. The first test run may hit the database, and the next five may hit Redis or an in-memory cache, making performance look better than it really is. Always run both cold and warm cache scenarios.
A subtler trap is not accounting for resolver-level variability. Without tracing data, you cannot tell whether one slow response came from a heavy query, an N+1 issue, or a transient backend problem. Resolver timing hooks, OpenTelemetry, Apollo tracing, or framework-specific instrumentation can help separate query cost from infrastructure noise.
Finally, do not confuse load testing with chaos. The goal is not to crash your API. The goal is to find the point where latency starts climbing, errors increase, or downstream services start to struggle. Past that point, you are measuring failure, not sustainable performance.
The right mindset is diagnostic, not destructive.
Interpreting GraphQL Load Testing Results and Acting on Them
Load testing is not just about collecting data. It is about translating that data into decisions.
Start with correlation. If latency spikes align with resolver call counts, you may have an N+1 issue. If CPU climbs while database metrics stay flat, your bottleneck may live in query parsing, validation, or response serialization. If p99 latency spikes only for specific operation names, those operations should become the focus of optimization.
From there, optimization paths open up:
- Batch Resolvers: Use DataLoader, query-level joins, or batching patterns to reduce redundant fetches.
- Add Caching: Use resolver-level, object-level, response, or persisted-query caching to reduce duplicate work.
- Implement Query Complexity Scoring: Reject, throttle, or require approval for pathological queries before they overwhelm the backend.
- Introduce Persisted Queries: Store pre-approved operations server-side to reduce parsing overhead and limit unpredictable client behavior.
- Set Depth and Rate Limits: Limit deeply nested queries and enforce fair usage across clients.
- Optimize Schema Design: Review fields that encourage expensive nested access patterns or excessive fan-out.
Once improvements are made, rerun the same load model. Performance tuning without retesting is just guessing.
Making GraphQL Load Testing Continuous
A one-off load test is a snapshot. A continuous one is an engineering advantage.
GraphQL schemas evolve constantly as products grow. New fields, joins, resolvers, and client features can shift performance characteristics. Every schema change can alter resolver paths, data volumes, permissions checks, or downstream calls.
Integrate scaled-down load tests into CI/CD pipelines, just enough to catch regressions before deployment. Keep your query sets updated as production traffic evolves. Schedule deeper tests monthly or before major launches to validate that optimizations still hold.
Treat performance as part of the schema lifecycle, not a separate phase. In GraphQL, every new field is a potential performance liability until proven otherwise.
Conclusion
GraphQL’s power lies in its flexibility. That same flexibility makes it easy to build an API that looks perfect under light testing but struggles under real-world query variety.
The right way to load test GraphQL is not about raw numbers. It is about context. Simulate real queries, measure the cost of their depth and complexity, and trace how each one fans out across systems. Understand the point where performance starts to degrade, not just the point where it breaks.
For teams running these tests at scale, LoadView helps extend the process beyond local testing. By executing JMeter-based or browser-driven GraphQL scenarios from multiple global regions, it provides a more realistic picture of performance under live internet conditions, including latency, variability, and regional behavior.
Used this way, LoadView becomes a proving ground for flexible APIs under real-world demand. With the right model, GraphQL load testing becomes more than a technical ritual. It becomes a map of how your architecture behaves when flexibility meets scale.