


Most enterprise load tests start with a number someone picked in a meeting. Five thousand virtual users. Ten thousand. The test passes, the report gets filed, and the application still falls over on the first Monday of the quarter.
Round numbers are easy to agree on and they tell you almost nothing. Real traffic arrives in bursts, splits unevenly across features, and shifts its mix at the exact moment volume peaks. A test that sends a flat wall of identical requests exercises a different code path than production does, with cache behavior, query plans, and lock contention that bear no relation to the live system.
Here’s how to build a traffic model out of data you already collect, and how to run it so the results mean something.
Table of Contents
- What Makes Enterprise Traffic Hard to Fake
- Where the Traffic Data Already Lives
- How to Build a Traffic Model From Production Data
- Where Traffic Models Go Wrong
- What Real Enterprise Traffic Shapes Look Like
- How to Run the Model in LoadView
- How to Check the Model Against Production
- The Bottom Line
- Frequently Asked Questions
What Makes Enterprise Traffic Hard to Fake
Three things trip up teams that go straight from a headcount number to a running test.
Concurrency and arrival rate are not the same number. When a stakeholder says “we need to handle 5,000 users,” ask which one they mean. Five thousand people signed in simultaneously is a completely different test from five thousand sessions starting every hour. Get this wrong in the generous direction and you’ll spend weeks tuning for load that will never arrive. Get it wrong the other way and the test tells you nothing. Concurrent user testing only means something once you know which of the two numbers you’re targeting. This is the split between an arrival-rate-driven model, which mirrors how users actually show up, and a concurrency-driven model, which holds a fixed population in the system. Public-facing traffic is nearly always the first. Systems with a bounded user base—call center desktops, licensed seats, agent portals—genuinely behave like the second.
Traffic has a shape, and the shape does the damage. Connection pools, autoscaling groups, and JIT-warmed application servers all respond to the rate of change, not just the ceiling. A system that handles 2,000 concurrent users comfortably can fail on the way to 2,000 if it gets there in ninety seconds.
The transaction mix moves with the volume. At average volume an ecommerce site sees mostly browsing. During a flash sale, checkout and inventory calls take a far larger share of the same request count. The total number looks identical on a dashboard. The database load is not.
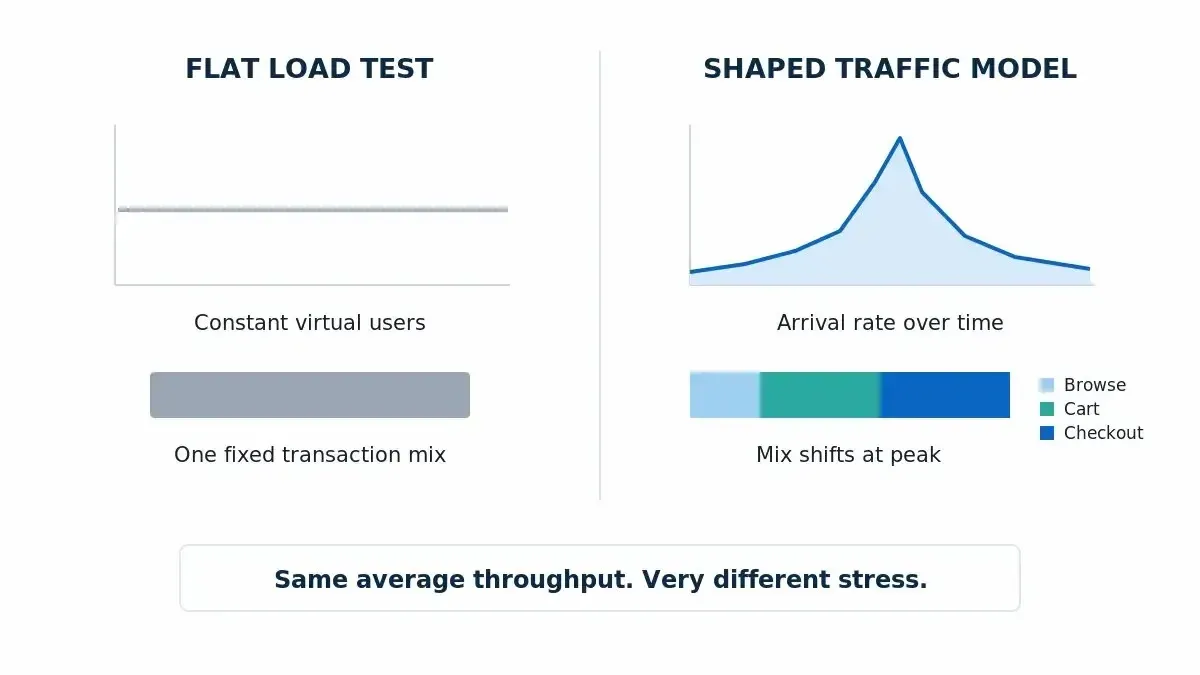
A flat virtual user count and a shaped arrival curve can produce the same average throughput while stressing entirely different parts of the stack.
Where the Traffic Data Already Lives
You don’t need new instrumentation. Most of this is already being written to disk somewhere. The work is stitching it into sessions and filtering out bot traffic before you count anything.
Source | What to pull from it |
|---|---|
Web server and load balancer access logs | Requests per second by endpoint, status code distribution, the real timestamp of your busiest hour |
APM or real user monitoring (Dynatrace, Datadog, New Relic) | Session duration, page-to-page timing, actual think time between interactions |
Web analytics (GA4 exports, Adobe Analytics) | Sessions per hour, device and browser split, geography, entry pages |
CDN logs (CloudFront, Fastly, Akamai) | Cache hit ratio, origin offload rate, which assets miss |
Identity provider or SSO logs (Okta, Entra ID) | Login rate and session concurrency, which is often the only usable signal for internal applications |
Batch scheduler and database | What else is running during your peak window |
Internal enterprise applications usually have no analytics tags at all. Auth logs and application server logs cover the gap—login events give you arrival rate, and the time between first and last request per session gives you duration.
How to Build a Traffic Model From Production Data
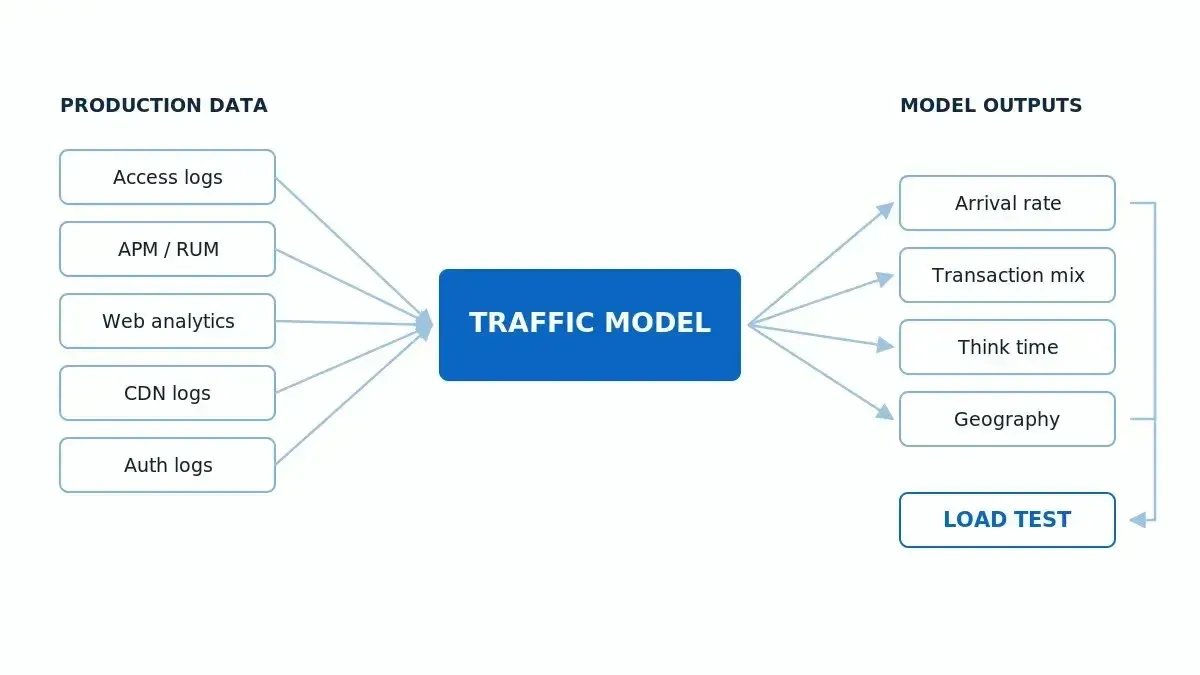
Four outputs define the model: arrival rate, transaction mix, think time distribution, and geographic split.
Step 1: Pick the Exact Window You’re Modeling
Not “peak traffic.” A specific hour, on a specific date, pulled from your logs. Take the highest-throughput hour of the last twelve months, then pick a second window covering your worst business event—month-end close, open enrollment, Black Friday, quarterly reporting. Model both. They almost never have the same shape.
Step 2: Count Sessions, Not Requests
Requests per second is the easiest number to pull and the least stable one. Ship a front-end release that bundles three API calls into one and your request count drops by a third with zero change in demand. Sessions per hour tracks what users are actually doing. The gap is widest on single-page applications, where one click can fan out into a dozen background API calls.
Pull sessions per hour for your window, plus the mean and 90th percentile session duration. Keep both numbers—the tail matters in step three.
Step 3: Convert Sessions Into Concurrency
Little’s Law connects arrival rate to concurrency:
Concurrent sessions = sessions per hour × (average session minutes ÷ 60)
18,000 sessions/hour × (6 minutes ÷ 60) = 1,800 concurrent sessions
Run 18,000 concurrent virtual users against that application and you’ve tested something ten times larger than your actual peak. You’ll fail a test you would have passed, then spend a sprint chasing a bottleneck that production would never reach.
Little’s Law takes the mean, so treat P90 as a separate sizing check rather than a second reading of the formula. Feed in a 22-minute P90 against that 6-minute mean and you get roughly 6,600—the concurrency you’d carry if every session ran as long as your slowest tenth. Deliberately pessimistic, and the number worth having for capacity planning when long sessions hold scarce resources like report threads or database connections.
Step 4: Break Traffic Into Business Transactions
Group endpoints into business transactions rather than URLs: search, view detail, add to cart, submit claim, export report, run payroll. Then record two mixes—each transaction’s share of traffic across the whole window, and its share during the single busiest minute.
If those two mixes differ by more than a few percentage points on any transaction, build both into the test and run them as separate scenarios. A test built on the hourly mix alone will under-load whichever transaction spikes hardest at peak.
Step 5: Pull Think Time From Real Sessions
Don’t guess at think time and don’t use a constant. A fixed five-second pause synchronizes every virtual user into a marching column that hits the application in lockstep, producing spiky throughput no real population ever generates.
Pull the gap between consecutive page loads inside real sessions from RUM or APM data and reproduce it as a distribution. Enterprise users tend to be bimodal: short gaps while clicking through a flow they know by heart, long gaps while reading a document or taking a phone call.
Step 6: Match the Ramp to the Real Curve
Plot per-minute session counts across your window and shape the test ramp to match it. Three shapes cover most enterprise applications:
- Near-vertical. Product drops, ticket on-sales, and market open. Peak concurrency arrives in under two minutes.
- Staircase. Internal applications waking up at 9 a.m. in each time zone, one step per region.
- Square wave. Batch and integration traffic. On at full volume, off at full volume, no ramp at all.
Step 7: Place Load Where Your Users Are
Take the geographic split from analytics or CDN logs and generate load from those same regions. This isn’t only about measuring latency for remote users. Latency feeds back into concurrency: a session held open by a 280 ms round trip lasts longer than the same session on a 20 ms link, so identical arrival rates produce higher concurrency. Testing everything from one region hides that entirely.
Where Traffic Models Go Wrong
One data set for every virtual user. Same login, same product ID, same account number across ten thousand users, and your cache hit ratio goes to nearly 100%. Production doesn’t behave that way. Parameterize with a data set wide enough to match real cardinality—an account pool, a SKU list, unique order IDs per run—then compare the test’s cache hit ratio against production’s before you trust any result.
Nothing else running during peak. Enterprise peaks collide with scheduled work: nightly ETL, index rebuilds, report generation, backup windows, replication catch-up. If the reconciliation job runs at 2 a.m. and your batch integration peak is also 2 a.m., a clean test environment with no background load is measuring a system you don’t operate.
Protocol-only tests on browser-heavy applications. An HTTP-level test replays the requests captured at record time. It won’t execute JavaScript, fire lazy-loaded calls, run third-party tags, or render anything. For a single-page application or a heavy internal portal, that leaves out most of the work the client actually does—and all of the work that determines what the user sees. Web application load testing in real browsers is the only way to measure client-side rendering under load.
The happy path only. Real traffic includes abandoned carts, back-button loops, failed logins, expired tokens, and impatient double-clicks. Failed logins are worth a scenario of their own: they hit the identity provider, usually bypass cache, and often trigger lockout logic that adds writes.
What Real Enterprise Traffic Shapes Look Like
Three patterns that come up constantly, and what each one demands from the model.
Retail Flash Sale or Product Drop
Arrival is near-vertical and the mix collapses onto three transactions: product detail, add to cart, checkout. If the product page is cacheable, the CDN hit ratio actually improves because everyone requests the same hot item, which makes a naive test look easy. The pressure lands on the uncacheable calls—inventory checks, cart writes, payment authorization—all hitting origin at once with row-level contention on a single SKU. Model the mix at the peak minute, not the hour.
Month-End Close in an Internal ERP
Session volume is unremarkable. Session length is not. Report exports and batch postings run for minutes, so concurrency climbs even though arrival rate looks flat—Little’s Law working against you. It also lands on top of the accounting close batch, so background load is part of the test. Split the long-running report and posting users into their own transaction class with their own duration rather than folding them into a single average.
Insurance Open Enrollment
Weeks of elevated load with a hard spike in the final two days. Sessions run long because people read plan documents, and they’re authentication-heavy and download-heavy. The multi-week portion is endurance testing, where memory leaks, connection pool exhaustion, and log volume matter more than peak concurrency. The final-days spike needs its own model.
How to Run the Model in LoadView
Once the model exists, the test setup follows from it. LoadView offers three load curves, and your model tells you which one to pick:
Load curve | Use it when your model says |
|---|---|
Load Step Curve | You have a target concurrency figure and want to see where response time degrades on the way up |
Goal-based Curve | Your model is expressed as throughput—transactions or sessions per interval—or you're validating an SLA |
Dynamic Adjustable Curve | You want to move load and regional distribution during the run to find where the system bends |
Record the session flow with the EveryStep Web Recorder so the script walks the same path a user does, in a real browser, across the desktop and mobile browsers your analytics show. Set the regional split using the geo-distributed load injection network to match step seven of your model.
For applications that never touch the public internet, on-premises injectors load test behind your firewall while reporting into the same platform—which is how most internal ERP and portal traffic gets modeled at all.
How to Check the Model Against Production
A traffic model is a hypothesis until you compare its output to the real thing. Capture the back end while the test runs—database wait events, connection pool saturation, queue depth, autoscaling activity, CDN origin fetch rate, identity provider throttling. Those signals explain the numbers below.
After the run, put five measurements side by side with production for the same window:
- Throughput per transaction. If test throughput sits well below production at the same user count, think time is too long or the script is missing calls.
- Transaction mix percentages. Drift here means the script’s branching logic doesn’t match how users move.
- Cache hit ratio. A test at 95% against production at 70% means the data set is too narrow.
- Error rate and error types. Production almost always carries a baseline error rate. A test showing zero errors is usually skipping something.
- Average session duration. This validates the whole concurrency calculation from step three.
Then analyze your load test results against those five, adjust the script, and rerun. Two iterations usually gets a model close enough to trust.
Frequently Asked Questions
How Many Virtual Users Do I Actually Need?
Calculate it from sessions per hour and average session duration rather than picking a round number. A system handling 18,000 sessions per hour with a six-minute average session carries roughly 1,800 concurrent sessions, not 18,000. Run the same formula against your P90 session duration for a pessimistic sizing check to use in capacity planning.
Can I Just Replay Production Traffic Instead of Modeling It?
Replay is useful for validating a model you’ve already built. On its own it has hard limits: recorded traffic carries personal data you have to scrub, session tokens that expire, and stateful writes you can’t safely repeat. And it can’t exceed the volume you recorded, which is exactly the volume you most need to test beyond.
How Often Should the Traffic Model Be Rebuilt?
After any release that changes the front end or the user flow, after a business change that shifts the transaction mix, and before any known high-load event. Quarterly is a reasonable floor for a stable application.
Should I Run Protocol-Level Tests or Real-Browser Tests?
They answer different questions. Protocol-level tests are cheap per virtual user and good for pushing back-end and API capacity. Real-browser tests execute JavaScript, fire lazy-loaded calls, and run third-party tags, which is the only way to see what a user of a single-page application experiences under load. Most enterprise programs run both.
What if My Internal Application Has No Analytics Data?
Use authentication logs for login rate and session length, application server logs for request volume by endpoint, and the batch scheduler for what else runs during your peak window. Internal applications rarely carry analytics tags, but they always carry auth and server logs.
The Bottom Line
A realistic traffic pattern is four measurements, not one number: how fast sessions arrive, what those sessions do, how long users pause between actions, and where they connect from. Every one of them is already sitting in your logs.
Pull those four, run Little’s Law to get a concurrency figure you can back up with data, and shape the ramp to match a real hour instead of a straight line. Then validate the run against production and adjust. It’s more work than picking a round number of virtual users, and it’s the only version of the test whose result you can act on.
Test Your Traffic Model in Real Browsers
LoadView runs your session flows in real browsers from over 40 AWS and Azure zones, with load curves you can shape to the arrival pattern you measured. Enterprise load testing plans add sub-accounts, SSO, and script migration from legacy tools.
Schedule a demo with a LoadView performance engineer to walk through your traffic model.