API Monitoring
The Ultimate Guide
API Guide Overview
APIs, or Application Programming Interfaces, are an incredible tool that allow developers to build great web APIs and applications, allowing for applications to talk with one another. APIs are used to retrieve, send, and exchange information from various web services. Whether you are aware of it or not, we use APIs every single day. For example, from booking a hotel room or airline ticket, to shopping for a product or checking the local weather, you are using an API. And the list goes on and on. APIs are involved in database and operating systems, software libraries, web-based software, etc.
For the everyday consumer or end user, what goes on behind the scenes is completely invisible. Like using a radio or an elevator, all the “magic” happens away from the user’s eyes. Want to change the station or change the volume? Just use a couple of knobs. Want to go to the 10th floor? Just press 10. For the user, their part is easy, and they only see and use what is made available to them. And when it comes to applications, it either works or doesn’t, or responds slow or fast.
To monitor APIs, developers use API monitoring tools to help proactively monitor API performance. This ultimate guide will discuss all the various facets of API performance monitoring, best practices, and solutions that can help developers and teams easily and cost-effectively monitor their business-critical APIs.
Why It’s Important to Monitor APIs
(You Should Definitely Be Doing This)
APIs are everywhere and involved in literally almost everything we touch digitally today. With that in mind, it is important for developers to monitor APIs, especially APIs that are critical to the bottom line of the business or APIs that are accessed and used by external users. Monitoring APIs for internal users, while still important, it may not be as critical to the business for small organizations. However, for large enterprises, these may be important to monitor. Larger enterprise businesses may need continuous insight to the performance of their APIs for thousands of internal employees. Ultimately, comes down to the needs of the business in terms of what APIs to monitor.
Monitoring APIs ensures that you and your teams are made instantly aware of any downtime issues, how APIs are behaving in terms of performance, and if they have completely failed. You cannot manually monitor every API endpoint, which is why it is important to set up API monitoring. Any web API or web application that performs slowly (or not at all) in the end user’s eyes, will likely result in the use leaving the application and finding the next closest replacement, which will typically end up being your competitor. The user experience is critical to the success of your organization and monitoring (and testing) APIs are a huge part of the process to ensure you are continually delivering that great user experience.
Benefits of API Monitoring
As mentioned previously, the reliance on APIs as steadily grown over the last decade as more applications have become available over the Internet. The rise in SaaS (Software as a service), cloud computing, and emerging technologies like containers and serverless applications, have all attributed to the increase of API development and usage. Due to this, the landscape has evolved and changed. Whether it is to gain a competitive advantage over a competitor, or pressed by end users, organizations benefit by integrating their services with third-party companies and providers. However, for all the great benefits that integration brings, it also brings another level of complexity and management.
API Monitoring can help alleviate the headaches and provide a cost-effective method to ensure that the APIs your organization uses and rely on are continually up and running. Downtime can cost organizations thousands of dollars per minute. Not only that, but monitoring APIs also allows you and your teams to get alerted the moment an API or web service begins experiencing issues and begin working on a solution to ensure it doesn’t go down. API monitoring allow companies to mitigate that risk and get back up and running as soon as possible. The earlier issues are detected, the less likely it will impact additional users, and most importantly, the bottom line.
What Happens If You Don’t Monitor Your APIs?
While we hope our APIs, websites, and web applications run smoothly all the time, we know that is not the case. There are far too many variables that can cause performance issues and downtime. And downtime will happen. No organization is immune, so not monitoring APIs and web services could have serious consequences. Organizations that rely on third-party API integrations lack control over the uptime or performance of those APIs. We already talked about the cost of downtime could have on your company, but the effects of downtime could have far more consequences to just losing revenue. Maintaining a great experience for your users is the priority and when users do not get that, the effects can be compounded.
Users and customers rely on your systems, APIs, web pages, and applications need to be functioning properly and always up and running. This quality reflects your company and the services it provides, as well as building trust with users. However, if any APIs begin to regularly fail or experience issues, and you and your teams are not aware of it, your users and visitors are going to quickly become frustrated and lose that trust. Customer confidence is a major factor in whether a customer chooses your offerings over your competition. Not monitoring your critical APIs can have serious consequences, so ensuring you set up continuous monitoring for your APIs cannot be understated.
Using an API Monitoring Dashboard
Why You Need One
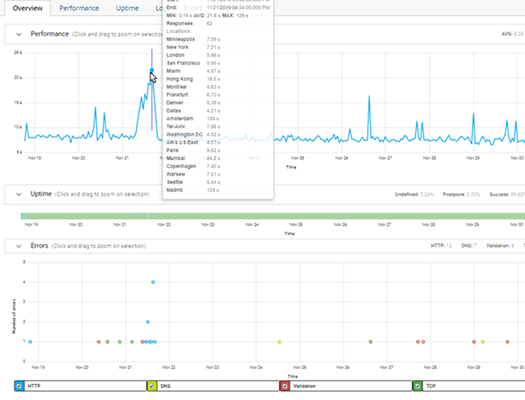
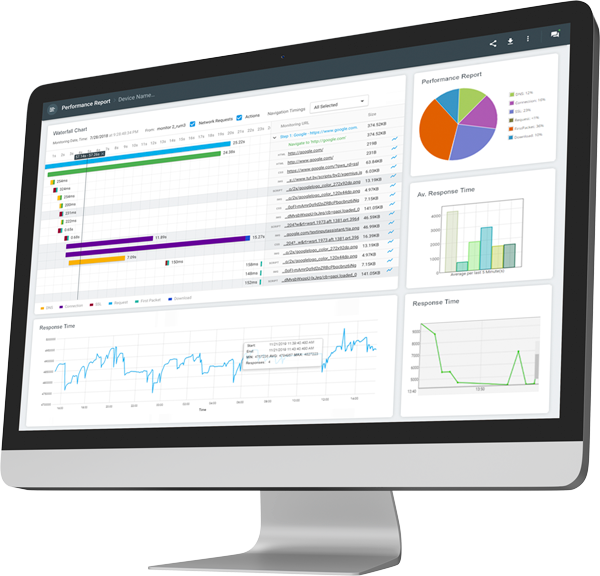
More organizations are relying on APIs to support their mission-critical solutions and services. However, organizations must also know that monitoring these APIs is necessary to understand how they are performing in front of real users. Like we touched on in the section above, a single failure can bring simple operations, and those dependent on certain APIs, to a complete halt. Utilizing an API monitoring dashboard like LoadView as part of a comprehensive monitoring solution for all your web page, web applications, and other web services can provide your teams with continual information on the health of your APIs and all your other web services.
API monitoring dashboards provide you with the data and metrics you need to ensure continuous performance of your APIs. You and your team invested heavily to develop and build your APIs, API monitoring dashboards ensure that investment pays off and performs to the specific needs and requirements of your business. Some APIs have complex, multi-step paths. Having a monitoring solution that can be configured to set up monitors for each step in the API call and response process is essential for identifying the most important metrics. That way, if you and your teams are alerted to any downtime and performance issues, you can begin resolving them immediately before it potentially impacts more applications and end users.
No credit card, no contract.
Web API Monitoring Explained
When we talk about APIs, you will often see that the term web API also gets thrown in the mix. These terms are essentially the same thing and used interchangeably today. So, it is generally known that when we say API, we are really talking about web APIs. However, to define it further, web APIs allow access to an application’s data over the Internet, or as the name implies, the web. If we want to go deeper, from a more technical standpoint, web APIs send and receive data via HTTP requests. Essentially, every time you type a URL into your browser, you are making a call to a web API. Those requests are sent to the server, which return a response in the form of JSON or XML. RESTful APIs and SOAP-based APIs are examples of Web 2.0 Web APIs.
Web APIs make it far easier for developers to work with as part of the application they are building, and ultimately, for the user. However, because these Web APIs are accessed over a network, latency, or the delay between the requests and responses, can occur. Not only that, other factors like geographic location, environment, and amount of data within the request can all affect performance. Web API monitoring, like web page or web application monitoring, is a vital step to ensure you web APIs, are always up and functioning properly.
Cloud Monitoring vs. Web API Monitoring
There are many types of monitoring that developers and operations teams can implement. We have already talked about what web API monitoring is and some of the advantages of why it is important to implement web API monitoring, but you have probably come across companies that offer cloud monitoring. What is the difference between cloud monitoring and web API monitoring? The IT landscape is evolving, so we will talk more about cloud monitoring and what it can do for organizations.
However, this brings another level of complexity as these resources are offloaded to a third-party. This inherently creates a need to monitor their entire infrastructure as there are more moving parts in play. Cloud monitoring allows organizations to gain a holistic view of all their assets, including websites, databases, API, applications, and more. From an API perspective, cloud monitoring allows APIs to be implemented as objects instead of multi-step operations, which provide an easier way to build consistent APIs that provide better performance at scale.
Web API Monitoring vs. Software-Based API Monitoring
There are different types of software-based monitoring types that organizations can implement. One type is real user monitoring, also known as RUM. Another type is synthetic monitoring. RUM, as the name implies, utilizes performance data from real users. One of the great things about RUM is that you get real performance data from your APIs, applications, pages, etc., as users experience it. However, this type of monitoring can be time consuming and expensive to manage, as you ultimately need a large set of data from real users to gauge performance across different locations, networks, etc.
On the other hand, synthetic monitoring uses pre-defined scripts that can be used to simulate behavior within an application or API. This makes it easy for teams to understand performance without having to stand up or rely on a live environment.
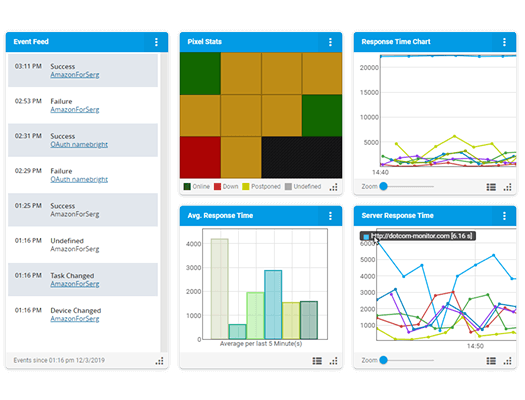
Synthetic monitoring is great for testing APIs from different environments, browsers, network conditions, etc. However, because the monitoring is simulated, it may not directly match real-world performance, however, it will provide very reliable data that teams can review in order to make improvements.
Web API monitoring and software-based API monitoring essentially mean the same. Both rely on a third-party solution to monitor API performance. However, how an organization goes about implementing which type of monitoring depends on budget, resources, and requirements. In some cases, a combination of both types is more effective, as it can uncover different performance bottlenecks.
API Performance Monitoring vs. Web API Monitoring
When we talk about API performance monitoring and web API monitoring, we are really talking about the same thing. Setting up an API monitor, whether you utilize a synthetic monitoring solution or RUM-based solution, you are trying to understand and gauge various performance metrics, from latency, downtime, errors, proper responses, etc. Ensuring that your APIs, and even the APIs your business relies on, are functioning and performing properly is necessary for ensuring a good experience for users. If any step within the API fails, that will affect the applications and pages, and in turn, causing them to also fail, which is obviously not good for maintaining your brand’s reputation.
Using a synthetic monitoring solution is great as teams can set up a basic monitor, which simply checks the response and response time of the API, or set up multi-step monitors that checks each interaction within the API to monitor the exact steps, authentication factors, redirects, etc. At any time, something could go wrong. Teams will continually receive updates on responses, performance, and other metrics, without having to manually go through steps or depending on a real user. Additionally, synthetic monitoring solutions typically allow users to choose from multiple locations, so teams can review performance and availability across different regions and countries.
AWS API Gateway Monitoring – How It Works
We briefly mentioned some of the major cloud services provides in a previous section, but let’s talk a little about one of the features within AWS, called Amazon API Gateway. Initially released in mid 2015, the Amazon API Gateway is a service within AWS that can be used by developers to create, publish, manage, monitor, and secure APIs. Specifically, the Amazon Gateway API provides support to create HTTP-based APIs, such as REST and the WebSocket protocol. The APIs created within the Amazon API Gateway can then be accessed by AWS, web services, data stored in the AWS Cloud, or even for internal or third-party clients and applications.
As far as monitoring APIs created with the Amazon API Gateway service, Amazon provides another service called Amazon CloudWatch. CloudWatch continually collects raw data, in real-time, so developers can review and access data over time to compare performance metrics. CloudWatch users can select to collect data as frequently as each minute. An additional benefit is that data is stored and available over a 15-month period. Common metrics, such as latency, response code errors, messages sent (for WebSocket-based APIs), and much more. CloudWatch provides a holistic view into API and application performance, resource utilization, and overall health of the system.
No credit card, no contract.
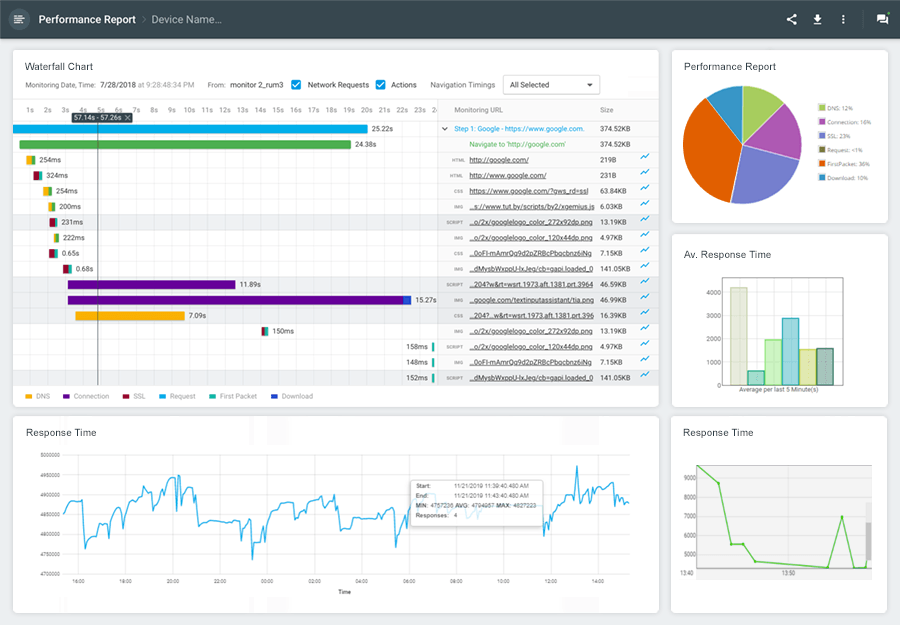
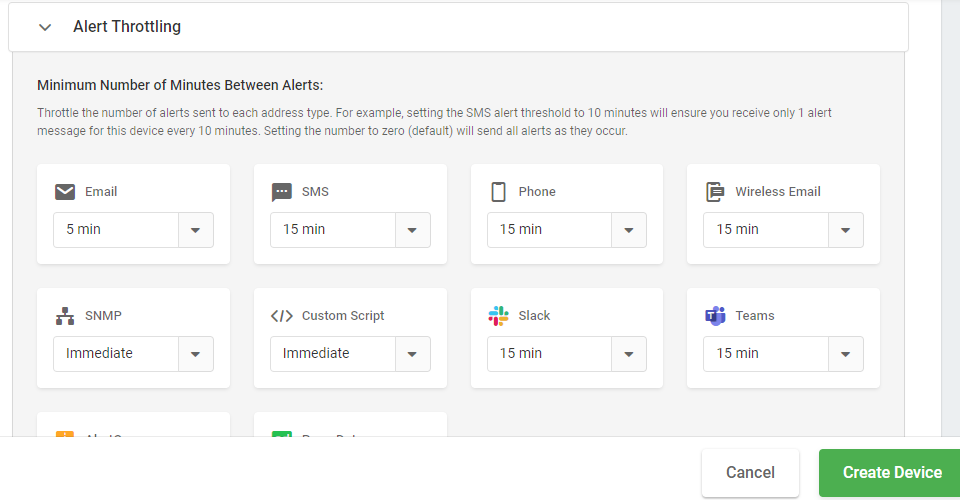
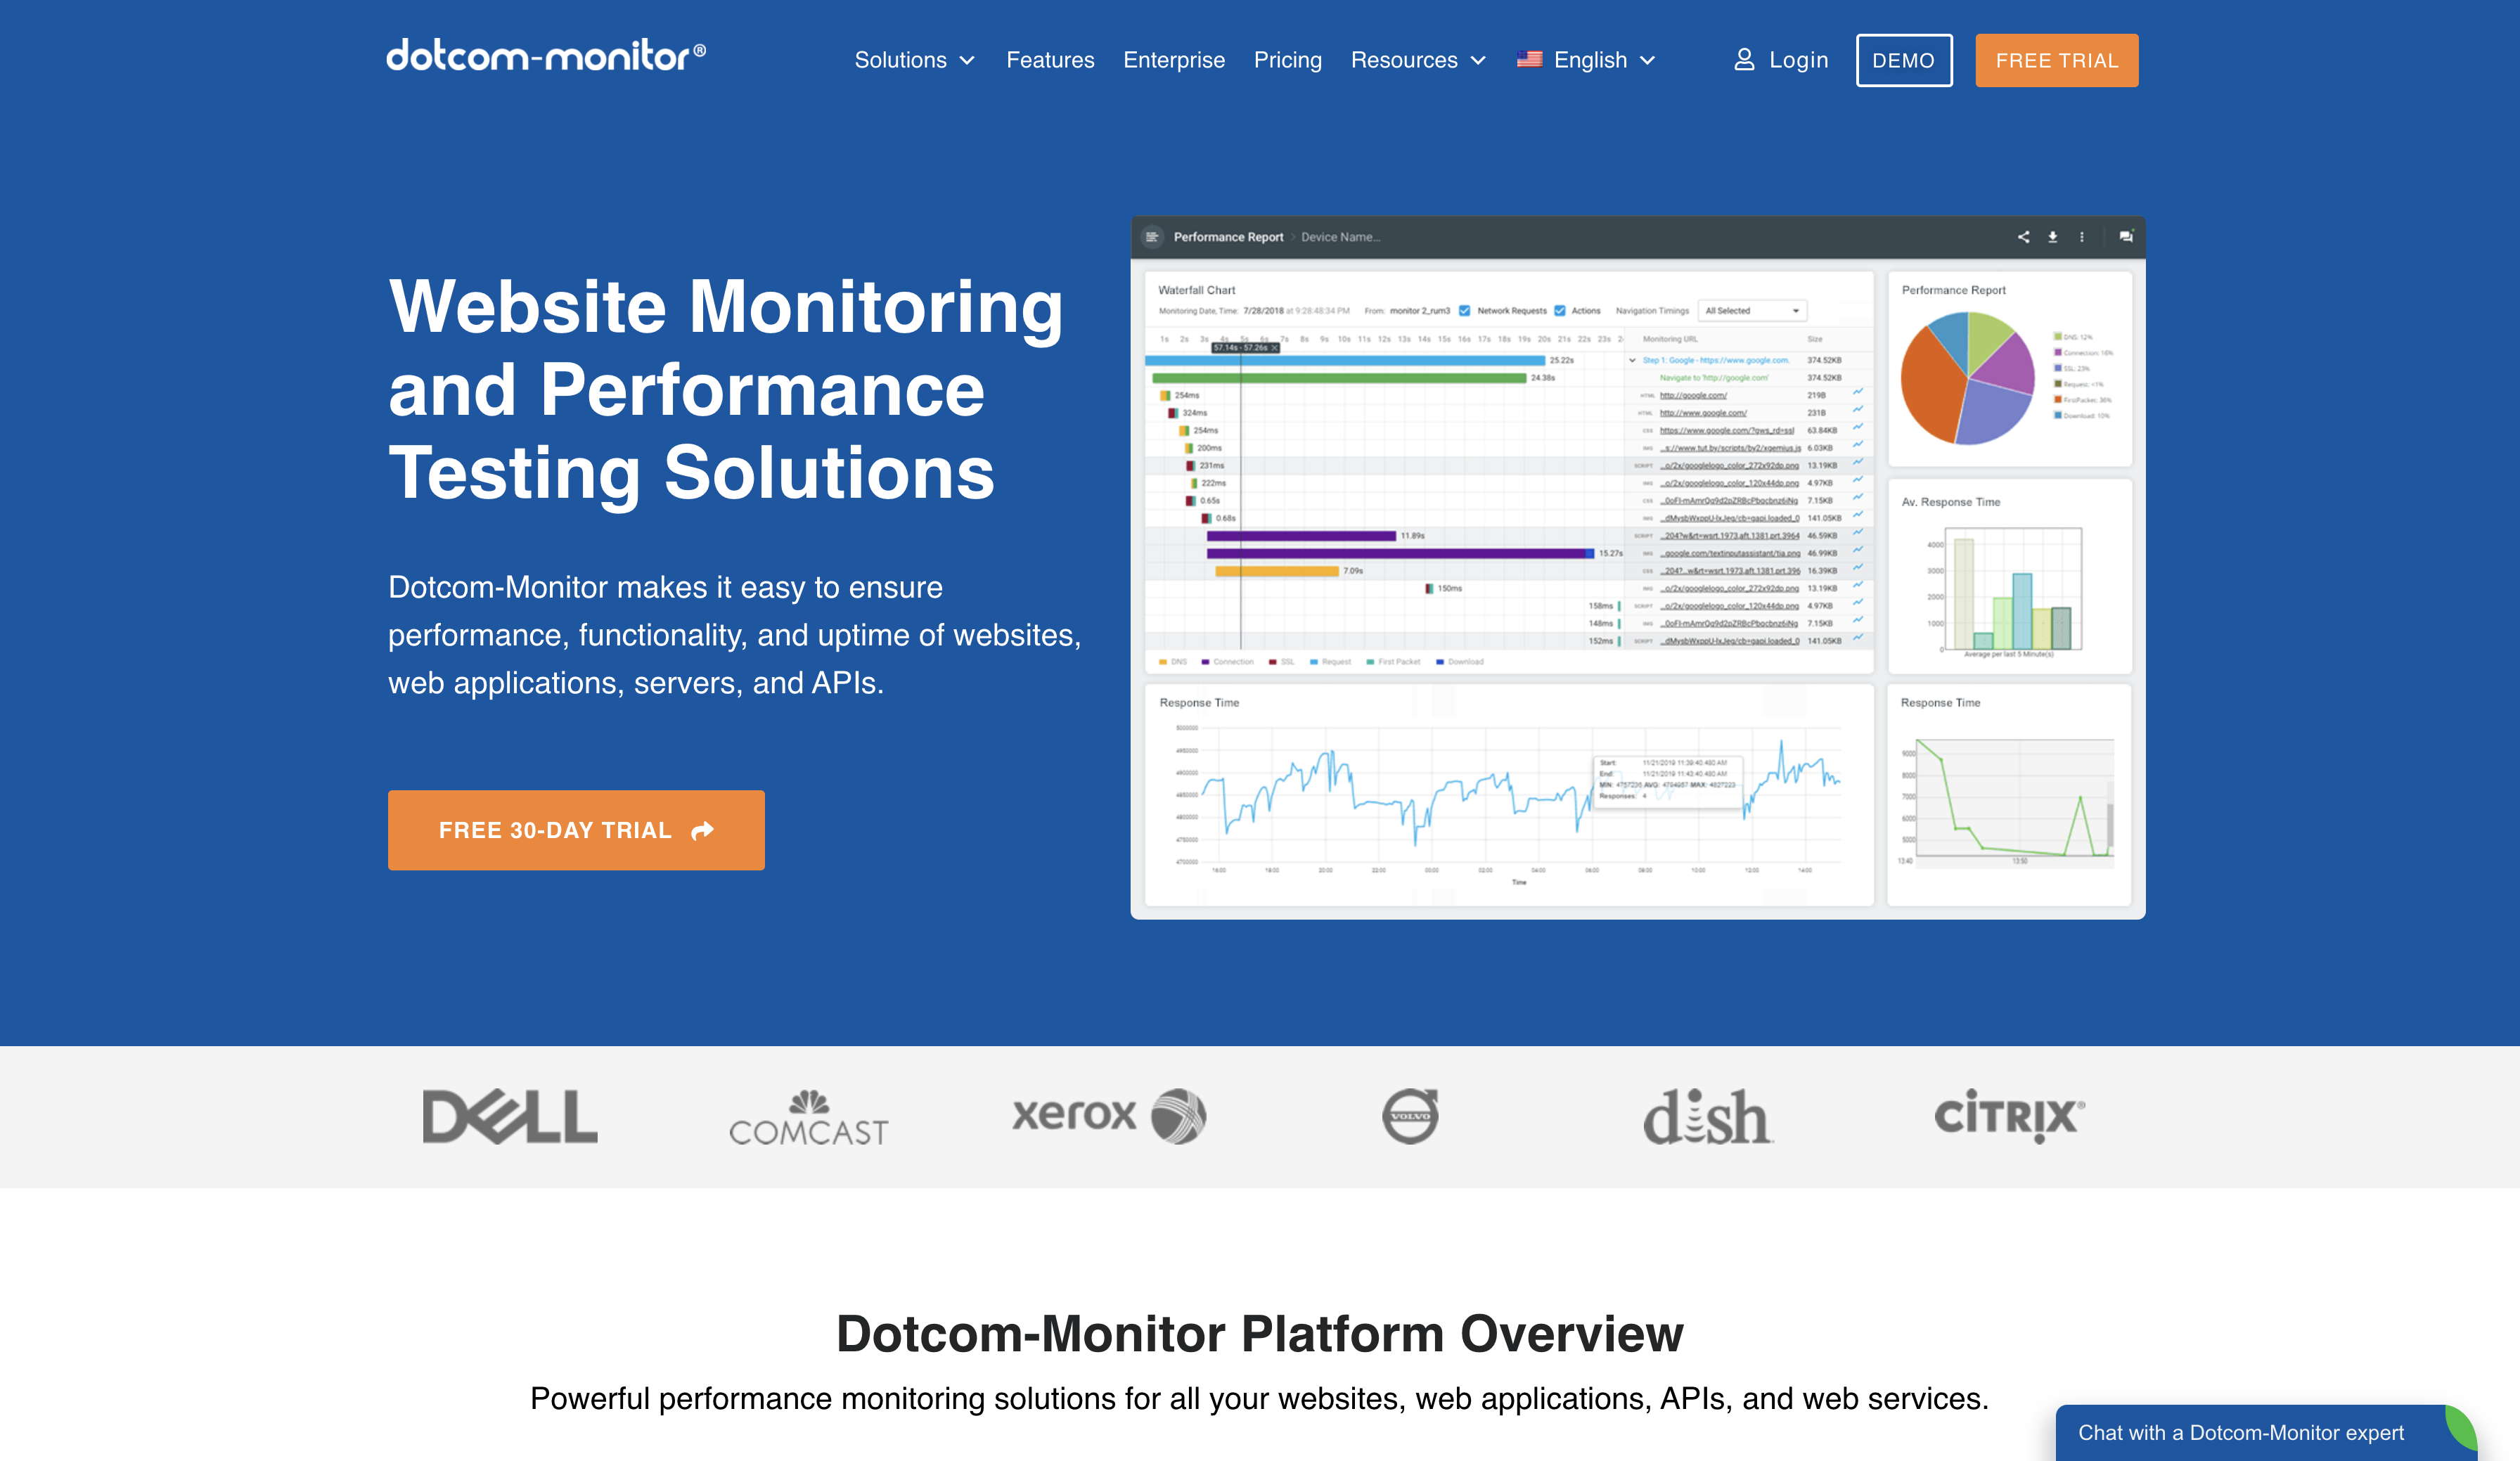
Monitoring APIs, whether they are your own or third-party that an application uses, is critical for many reasons, like user satisfaction, revenue, and brand reputation. The WebView solution within the Dotcom-Monitor platform provides users with the ability to set up monitoring devices for all your APIs and web services to continually check for uptime, functionality, and overall performance. Other features include choosing from a variety of monitoring check frequencies, 3-year data retention, and nearly 30 external monitoring locations. Choose from multiple alert delivery mechanisms, such as email, SMS, Phone, as well as integrations your organizations already use, like PagerDuty, Slack, Teams, and more. Get alerted the minute issues occur.
Let’s look at how easy it is to set up API monitoring within the Dotcom-Monitor platform.
Tutorial: API Monitoring with Dotcom-Monitor
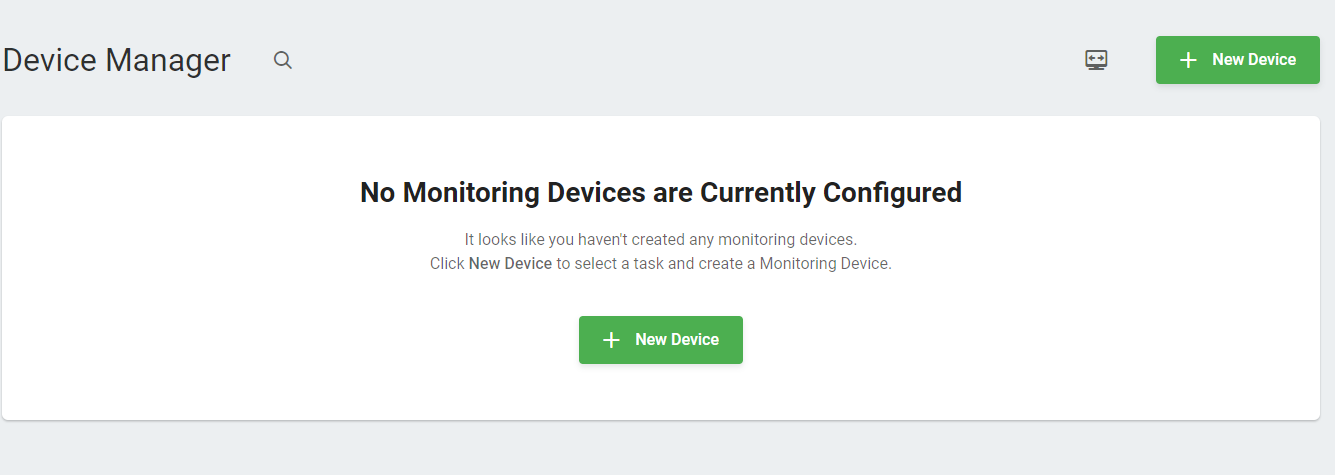
To begin, you will first need to sign into your Dotcom-Monitor account. If you do not have one, no worries. We offer a free trial with access to all the solutions within the platform, so you can try it out, hassle free. Once you have logged in, you will want to select New Device at the top right-hand side of the page.
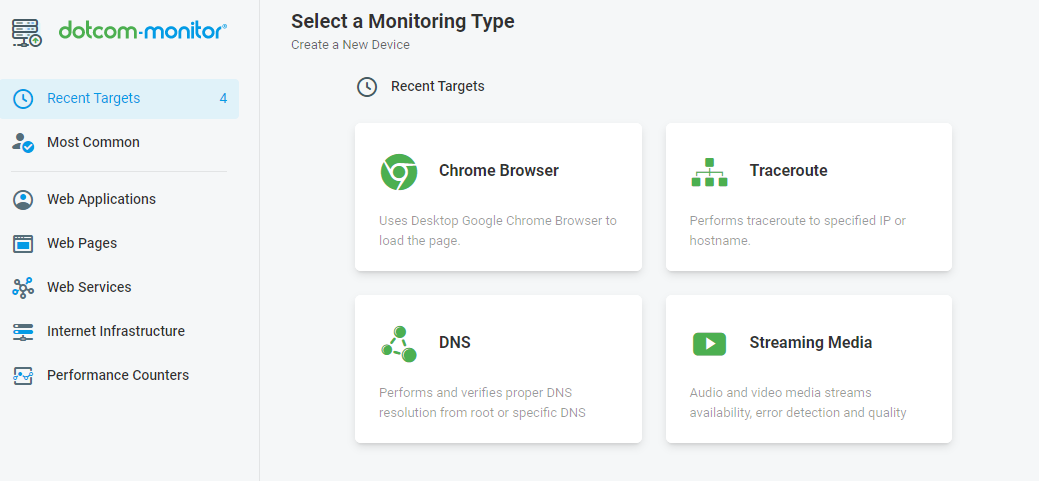
From this page, you can either scroll down and select Web Services, or simply select Web Services from the left-hand side. Once you have selected Web Services, you will be shown a list of monitoring devices you can create from within the Web Services monitoring type. The following monitoring devices will be shown:
- HTTP/S
- SOAP Web API
- REST Web API
- Postman Collection
- Ping/ICMP
- Telnet
- WebSocket
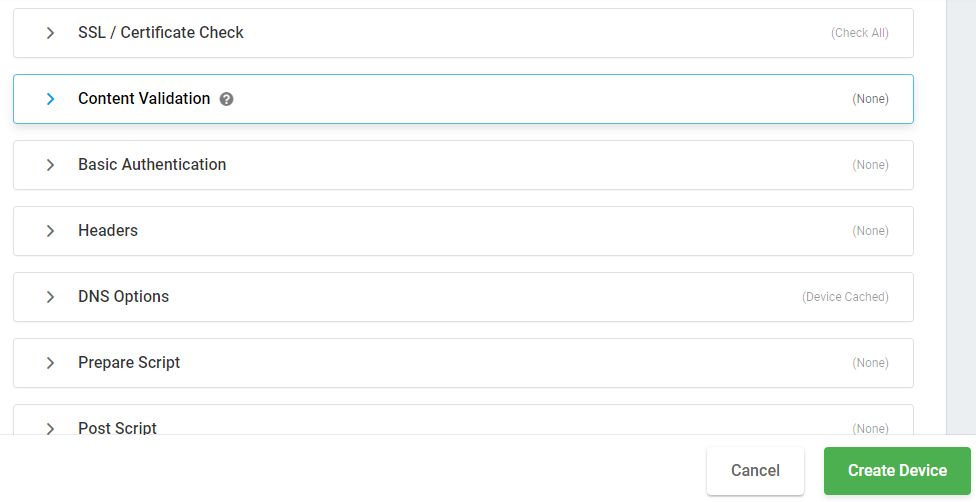
For the purposes of this article, we will select the REST Web API device option. Once a user has entered the target URL or address, they can select from multiple options, such as checking for specific API functionality, uptime/downtime, content validation, authentication, completion timeout, as well as overall performance.
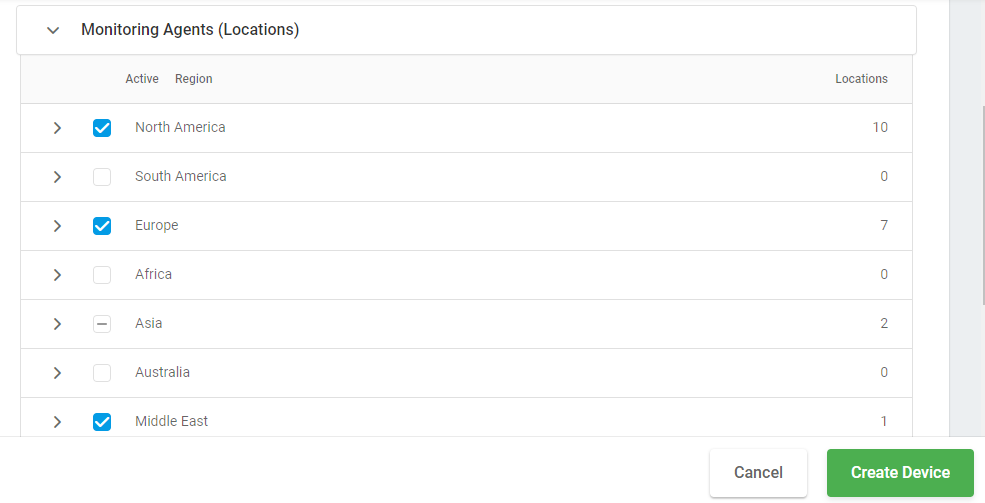
Once those settings have been defined, users can then select what frequency they would like to set up the checks for, as well as from what locations. Users have access to nearly 30 locations.
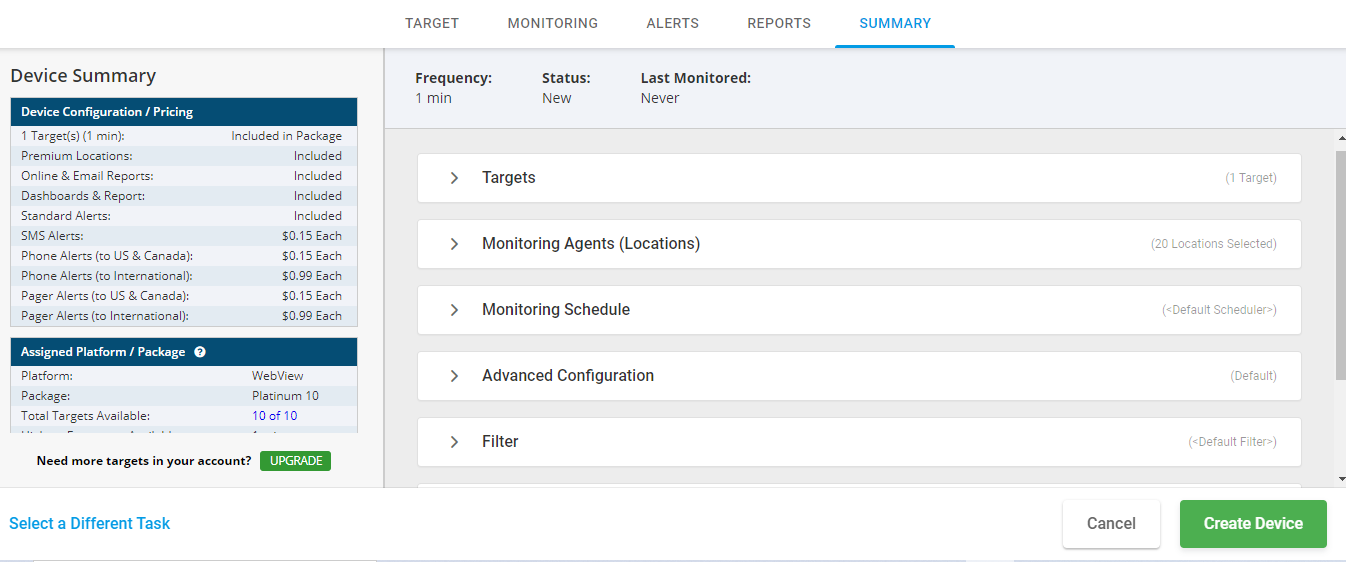
Once you have made selections for all your settings, you can review the Device Summary, make any revisions, and select Create Your Device.
And that is it! You are on your way to monitoring your REST APIs. Again, this is just one option within the WebView solution, so if you would like to learn more about the other WebView device options, such as WebSocket, Postman Collection, SOAP, Telnet, or Ping/ICMP, please visit our Knowledge Base.
No credit card, no contract.
API Monitoring Best Practices
In this section, we will cover some of the best practices for monitoring APIs. APIs come in many forms and varieties, from mission-critical APIs that serve thousands or millions of users, to APIs that simply provide simple command and response data. Whatever the case may be for your organization or business requirements, monitoring how your APIs perform will ultimately influence the user’s experience. We will go over some of the more basic monitoring best practices that teams should put in place, to some of the more complex forms for API monitoring.
APIs can be used to enrich the experience of the user on many levels, so different levels of monitoring can be implemented to suite your needs. Additionally, beyond the complexity level of APIs, there are different types of APIs. Some may be internal to your company, some may be open APIs, and some may be third-party, or partner APIs, that your company relies on to carry out and support business requirements. While not every API may need to be monitored, just know that if API issues occur, you will need a way to understand where the issues are arising from. This way, you can fix the issue so it does not happen again, and possibly gain some insight that you can use and consider for future API development or integration.
API Monitoring Basics (For Beginners)
Ensuring that your APIs remain functioning and available, under all types of traffic levels, is the basic reason why you want to monitor your APIs. Teams put a lot of time, effort, and resources to create a great application. Typically, issues start to present themselves during heavy traffic periods, but depending on the type of API used, issues could happen at any time. Monitoring availability and response times, or latency, are a couple of the basic forms of monitoring implemented.
Like we covered in the section above, API monitoring can come in many forms and levels of complexity, however, monitoring availability is one of the easiest and simplest methods to put into place for monitoring your APIs.
The whole point of monitoring APIs is to ensure that you and your teams are made aware of any issues. The worst thing to have happen is to start getting complaints from users and customers. And lastly, internal monitoring is not enough. It is possible everything is working fine internally, but if you are not checking your APIs from a user perspective, you could be putting your company at risk. Setting up basic external monitoring from the location or regions your users visit from will give you a better understanding of API performance issues.
Intermediate API Monitoring
Taking the basic idea of API monitoring a step further, more intermediate API monitoring may be necessary for APIs that include multiple API calls or multi-step procedures. Monitoring just the response back from an API endpoint may not always give you a clear picture of what is really going on. While you may get a 200 OK response back, there may be issues with the steps in between. An error may be occurring somewhere in the middle. Everything on the surface may be looking fine, but if you are not monitoring the whole process, it is possible that an error is buried somewhere in the middle. If you are not looking for it, you will never truly know what is going on underneath.
Advanced API Monitoring Techniques
When most people thing about API monitoring, they may assume that it is just like website monitoring. Just because you can see that your web pages are functioning does not necessarily mean everything is working properly. However, many make this assumption and that is a huge mistake. And like web page monitoring, there are many factors and levels that make up how an API performs overall. Like we mentioned in the previous section, just because you are getting a 200 OK response, does not mean all is well. While APM solutions and various networking tools may help with this, these solutions not able to detect errors within the various API layers like a dedicated API monitoring solution can.
In order to fully understand API performance, you must implement advanced monitoring techniques and closely matches how your users use your APIs. This includes using a solution that can support API monitoring checks every minute, 24/7. Additionally, for the most mission-critical and business-critical APIs, you will need a solution that goes above and beyond just monitoring requests and responses. This means using a solution that can monitor authentication methods, request types, timeout thresholds, content validation, custom headers and custom scripts, and alerting mechanisms. All these factors need to be monitored and configured to ensure your monitoring APIs thoroughly and alerted immediately if errors start popping up. And lastly, and we mentioned this before, being able to set up monitoring from external locations ensures that you are simulating as close of an experience to your users as possible.
API Monitoring Pros and Cons
When it comes to ensuring your APIs are continuously performing as you have intended, API monitoring is essential. As more organizations turn to developing and utilizing APIs for business, the advantages that API monitoring brings is essential to keeping customers and users happy, as well as providing a seamless experience. As we have talked about before, just the slightest delay in load times can make users frustrated. Additionally, because APIs can consist of and rely on different resources, issues can occur at any time. Setting up monitoring to be alerted when something goes wrong is key to keeping business continuity.
There really is no disadvantage to monitoring APIs, other than the cost associated with the monitoring tool or solution you use. There are a myriad of tools and solutions, and we will talk about those more in detail in the following sections, but it comes down to understanding what it will cost you organization if you do not have any API monitoring in place. The cost of downtime for some applications can be devastating to revenue and brand reputation. Your organization will have to decide if forgoing API monitoring will affect the business negatively, and to what extent you are willing to put the business at risk.
API Monitoring Checklist
Before beginning any monitoring or configuring your API monitoring devices, it is best to create a checklist or plan to ensure you and your team cover all the necessary requirements and metrics you are going to want to measure and report on. As we previously discussed, just knowing that an API is functional is not enough. At any time, something could go wrong, and you want to make sure you are notified if, and when, it does. Here are some tips to consider and include when creating you API monitoring checklist.
- Make record of all the APIs your organization has developed, as well as any third-party APIs to may not have complete visibility into.
- Once you have record of all the APIs, prioritize the APIs from most critical to least critical. APIs that are critical to the business, user experience, or continuity of service should be prioritized at the top.
- Consider the complexity or technologies that the APIs rely on, such as authentication and authorization methods, security, multi-step APIs calls, etc.
- Set up monitoring from multiple locations depending on where your users are located and to compare ongoing performance against multiple locations. If errors occur in one location, you will want to monitor what is happening in other locations to rule out more widespread issues or if it is just a one-off event and remedy appropriately.
- Determine the monitoring frequency for your APIs based on priority. Not all APIs will need to be monitored every minute of the day.
- Set up alerts and ensure the appropriate stakeholders are notified when errors or issues arise. The longer issues continue, the more you put the business, and your users, at risk.
- Most importantly, find a monitoring solution that supports the latest technologies and protocols, and provides a wide range of features and options for your API monitoring.
No credit card, no contract.
API Monitoring Tools
API monitoring tools allow developers and teams to keep track of API availability, downtime, and overall performance. While it is great if you can perform manual checks on your APIs, this method is not always the most efficient use of time. Your organization may have hundreds of APIs. Dedicating someone to have to carry out manual checks is burdensome, and if only carried out internally, may not reflect the actual performance from an outside user’s perspective. Additionally, if you are not checking your APIs at the exact moment issues are occurring, they will go unchecked without you knowing, and end up compounding the issue more later down the road.
Monitoring tools are great for automating the monitoring process versus having to make APIs checks at random times. API performance is dependent on many factors and relationships, and because of this, issues can occur at any time. It is the unpredictable nature of APIs that make API monitoring tools essential for organizations. They can quickly alert you and your teams the moment issues arise, so corrective actions and troubleshooting can begin as soon as possible to avoid more users being impacted. There are many API tools that can assist with collecting performance data, such as latency, response codes, failures and successes, redirects, all from various locations around the world. We will talk about the different types of API monitoring tools and what sets each type apart from each other.
Free vs. Paid API Monitoring Tools
If you or your team is in the market for an API monitoring tool, you are in luck, as there are many to choose from. The bad part is that there are a lot to choose from, which can become a time-consuming process when you are looking for the right one. From free, paid, open-source, freemium options, and everything in between, you will surely find a tool that can meet your organization’s needs. Even more, tools like Postman, which is a full API development ecosystem, used to create, develop, and maintain APIs, includes basic monitoring features within their paid plans. So, what should you consider when looking at free versus paid API monitoring tools?
When it comes to comparing free API monitoring tools versus paid API monitoring tools, as the name implies, free API monitoring tools are free to the user. There is no upfront costs or investments to use them. Sometimes, these free tools are also of the open-source variety, like Nagios, however, free API monitoring tools typically do not have as a robust feature-set as a paid API monitoring tool. Free API monitoring tools will typically allow you to perform basic uptime and response checks. Additionally, free API monitoring tools will not typically allow you to take advantage of updates, offer limited protocol support, and may not be as secure as paid API monitoring tool options, which are important factors to consider, especially for larger organizations.
Paid API monitoring tools will often include additional features, add-on choices, multi-protocol support, access to ongoing updates, and offer global monitoring locations, which is key to understanding how APIs are performing from where your users are located. Additionally, support is a major differentiator between free API monitoring tools and paid API monitoring tools. Support options with free API tools are typically limited and may only be available through FAQs or support documents, with no access to a dedicated 24/7 support team.
Free API Monitoring and Testing Tools
There are a host of free API monitoring and testing tools in the market today. Examples of some of these include tools like REST Assured, Katalon, JMeter, Test Mace, and others. Additionally, some of these free tools also offer paid plan options, as well as being able to test web services, applications, and web pages, in addition to APIs. One of the main drawbacks to using free API monitoring and testing tools is limited protocol support and distributed testing. For example, a tool like REST Assured is Java-based, so you must also have Java installed in order to be able to take full advantage of it.
Katalon is another popular tool that is easy to set up and configure, however, the only scripting languages that Katalon supports is Java and Groovy, so anyone who is familiar with Java or Groovy frameworks would be comfortable using it, but not all applications and APIs use Java and Groovy, so finding an API monitoring tool that supports more scripting languages would probably be preferable to some teams. Katalon can also be used to automate testing for web services, as well as mobile and web applications, but cannot be used to create automated tests for desktop applications.
JMeter was created more as a load testing tool, but it does have the ability to carry out functional tests for APIs. One of the benefits of using JMeter is that users can create functional tests and then upload those tests for performance testing. One of the known downsides to JMeter is that it cannot execute JavaScript, which may be fine for API testing, since you may only want to understand how your APIs respond during higher load levels, but if want to know application and API performance from the user’s perspective, you would want a tool that can support real browser-based testing.
Open-Source API Monitoring Tools
For example, commercial API monitoring tools typically include access to dedicated support teams at any time of the day. If you experience an issue with the API monitoring tool, users of open-source API monitoring tools must unfortunately rely on an extensive knowledge base built by the community users. While there are tools that quality repositories, having to go through the effort of trying to track down the exact issue will likely be time-consuming. If you are thinking that an open-source API monitoring solution is the way you want to go, make sure you choose one with an extensive knowledge base and community support. You will not be able to access a team of dedicated professionals as you would with a paid, or commercial-based option.
No credit card, no contract.
Paid API Monitoring Tools & Solutions
We have already talked about some of the benefits and disadvantages of free and open-source monitoring tools and solutions and how they compare to commercial, or paid, solutions, so let’s look at some of the most popular paid API monitoring tools and solutions in the market today. When considering a paid API monitoring tool, you will want to ensure that it meets all your technical requirements as well as meets the budget requirements set by management.
Dotcom-Monitor
Dotcom-Monitor provides synthetic monitoring solutions for web pages, web applications, infrastructure, and web services. Within the Web Services Monitoring solution, WebView, users can monitor uptime, performance, and availability to ensure specific API functionality, uptime/downtime, content validation, authentication, completion timeout, and overall performance. WebView includes support for monitoring RESTful and SOAP-based APIs, SSL certificate checks, and WebSocket-based applications. Setting up monitoring task takes only a few minutes. The platform takes you through each step of the setup process, from device setup and configuration, to selecting alerting, reporting, and dashboard options. Dotcom-Monitor also integrates with many of the tools your team probably already uses, like Slack, PagerDuty, Asana, VictorOps, Splunk, and many more. Set up checks as frequent as every minute or every three hours, as well as choose from 30 public monitoring locations or monitor APIs from within your network with a Private Agent. Additionally, if you use already use Postman, you can import your Postman API calls for monitoring from a JSON file or shared Postman link.
Beyond API monitoring, the Dotcom-Monitor platform also provides a web application monitoring solution that allows you to quickly and easily create multi-step scripts for your web-based applications and services. The Dotcom-Monitor platform utilizes the EveryStep Web Recorder that provides users the ability to create scripts by simply navigating through the application like a typical user would do. These scripts can then be used to create web application monitoring devices to ensure that your users are able to log in to portals, browse and purchase products, and more.

Uptrends
Like the monitoring offerings of Dotcom-Monitor, Uptrends offers synthetic monitoring products for websites, web applications, servers, and APIs. Their API monitoring product allows users to check APIs for uptime, functionality, and availability. Setting up user scenarios and monitoring the exact paths and sequences they take through an API is critical for understanding performance, as it relates to their perspective. The Uptrends API product supports features like authentication, content validation, request duration, HTTP status codes, and more.
However, unlike the solution from Dotcom-Monitor, there is no Postman API monitoring integration. Uptrends does offer Private Checkpoints, which allows users to monitor APIs from behind their network to help identify issues that may not be visible from external locations. Additionally, Uptrends users have access to over 200 monitoring locations, however, if you are using Uptrends to monitor your web pages and sites, just note that not all locations offer real browser-based monitoring. Some locations offer basic HTTP/S checks.
Site24x7
Site24x7 offers is an all-in-one monitoring suite for development teams looking to monitor APIs, websites, servers, and web applications. Site24x7 supports SOAP and RESTful-based API services, authentication methods like Basic/NTLM (Windows NT LAN Manager), OAuth, and PKCS (Public Key Cryptography Standards).

Site24x7 offers users the options of choosing over 100 global monitoring locations, however, each monitor is capped at 8 locations, or 16 locations if you are using their Enterprise-level plan. While Site24x7 is a comprehensive monitoring platform, it may be a bit overwhelming at first and you may end up paying for features that you do not even need. Because of this, the plan you choose may be more expensive compared to other monitoring tools in the market.

Amazon CloudWatch
While most of the tools and solutions in this list provide dedicated website, application, server and API monitoring, we cannot forget about monitoring solutions within cloud providers, such as AWS (Amazon Web Services). As you are probably aware, AWS provides an entire ecosystem of cloud computing services and solutions.
If you have deployed your applications, websites, containers, microservices, APIs, web services, etc., on the AWS infrastructure, it is best to also utilize their monitoring capabilities. While API monitoring is not offered right out of the box, users can opt-in to use it. Similar to APM solutions in the market, like Datadog or Dynatrace, CloudWatch collects data from various AWS service logs and metrics, as well as on-premises data, allowing users to view performance across their entire stack and set alarms based on performance thresholds and errors. While this allows for complete visibility into stack, it can also add up to a lot of information and data, which can be hard to follow and troubleshoot when errors happen. AWS is built for enterprise-level companies and some of the largest companies in the world depend on AWS for their services.
AlertSite
AlertSite, from SmartBear, is their product for monitoring APIs and checking uptime, availability, and functionality. SmartBear also provides solutions for API development, called SwaggerHub, and API functional and performance testing, called ReadyAPI.

Like Dotcom-Monitor, AlertSite is a synthetic, real browser-based monitoring product for APIs, websites, and applications, and offers over 350 external monitoring locations. As it pertains to API monitoring, AlertSite supports technologies like SAML/SSO and OAuth for APIs. They also offer what they call a ‘hybrid deployment,’ which is essentially the ability to monitor from external and internal networks. Also, supports AlertSite users have access to a script recorder, called DejaClick, like the EveryStep Web Recorder from Dotcom-Monitor. Lastly, AlertSite users can set up alerts based on specific performance requirements and integrates with many other incident management tools. From a budgeting perspective, compared to other in this list tools, AlertSite can be expensive.
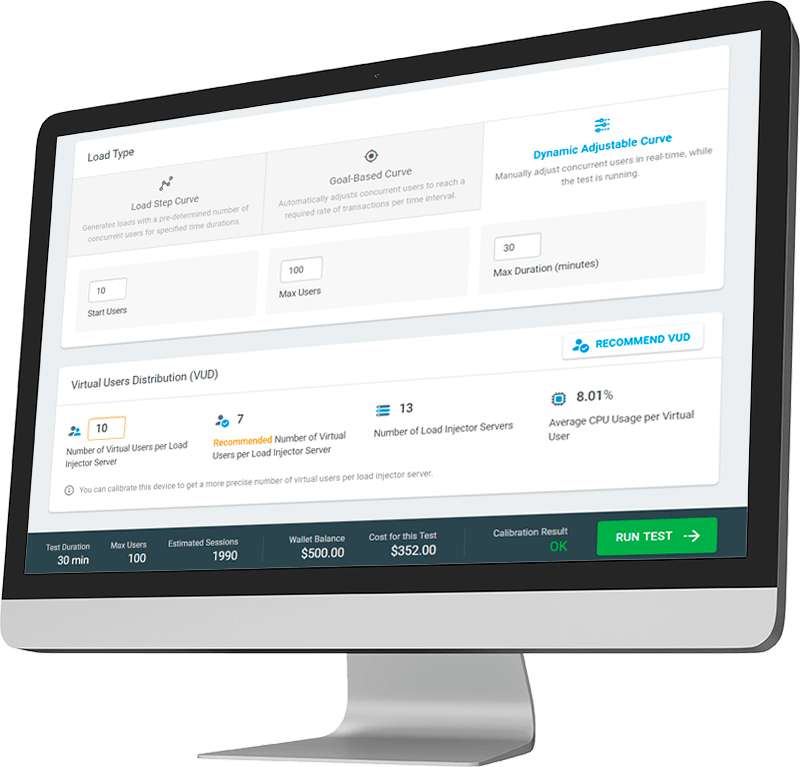
All from one convenient load testing solution, LoadView.
FAQ Section – API Monitoring Questions Answered
Setting up your API monitoring can take some time and requires some planning to adequately measure performance. However, with the right API monitoring tool, you can quickly and easily set up test devices, or monitors, for your most critical APIs and ensure your services are always up and running. In a perfect world, everything would run without incident, however, we all know servers go down, latency issues occur, etc. There is a myriad of issues that could occur, at any time, so protect your business and your customers by implementing API monitoring.
Listed below are some answers to the most frequently asked questions about API monitoring.
Table of Contents
- How is API monitoring performed?
- What happens if I don’t monitor my API?
- Are open-source API monitoring tools as good as paid tools?
- What are API monitoring tools?
- Who performs API monitoring?
- How is API monitoring performed on websites?
- Is it hard to set up an API monitor?
- What’s the difference between API monitoring and API testing?
- Is it worthwhile to performance test my API?
- How to you calculate API uptime/downtime?
- How do you benchmark API performance?
- What is a good response time for a web-based API?
- Should I use external or self-hosted API monitoring?
- Is it important to have alerting along with API monitoring?
- Do AWS and Azure have built-in API monitoring tools or programs?
- What is the best API monitoring tool?
How is API monitoring performed?
As we covered in earlier sections, synthetic API monitoring utilizes an external, or remote, server to send requests to your API. The server returns a response, along with data on response time, content, speed, etc. If this response does not meet or fall within your pre-defined thresholds, then an error message is returned. In certain cases where an error is detected, some solutions and tools will send an immediate request to ensure it wasn’t a false positive. If the error happens the second time, then the error is flagged. Monitoring tools can be used to automate these checks with a variety of frequencies, from every second to every three hours, depending on the needs of your business.
What happens if I don’t monitor my API?
APIs are critical components that send data back and forth between websites and web applications. They are the messengers between programs. Your development teams put in a lot of time coding, developing, testing, and optimizing your APIs. While we would all like to think that once we have created something, we do not have to worry about it again, we know that is not the case. APIs in particular rely on many different components. For example, if you are managing an e-commerce company, you may utilize a third-party API that allows for updates on products, pricing, descriptions, etc. Monitoring these APIs allows you to ensure that you are providing up-to-date information for customers, that they are working as expected, and provides a more seamless experience. If customers have issues with your services, they are more likely going to bounce and find it somewhere else.
Are open-source API monitoring tools as good as the paid tools?
When it comes to deciding whether an open-source or paid API monitoring tool is best for your organization, you must consider factors like what technologies and frameworks you need support for, external monitoring locations, alerting and reporting capabilities, and more. A lot of open-source, or free, API monitoring tools can provide basic monitoring uptime checks, but if the API you want monitored is going to be accessed by users from around the world, you will want to find a tool that can check from external locations, not just how that API performance internally. Additionally, while open-source API monitoring tools allow for more customization, they typically require extensive programming language. Paid API monitoring tools are typically purpose-built to support many protocols, frameworks, and languages.
What are API monitoring tools?
API monitoring tools are used to check availability, uptime, functionality of APIs, and are used by development teams to understand ongoing performance of their APIs. API tools allow teams to alerted when errors and performance thresholds occur, so they can quickly troubleshoot and fix the issues before any more users are impacted. The applications your customers and visitors use depend on APIs to function. Understanding what is going on in the background with your API sequences or endpoints is critical to safeguarding the user experience. We have discussed in this guide, API monitoring tools come in different forms, such as open-source or proprietary, commercial-based options.
Who performs API monitoring?
Like website, web page, or web application monitoring, API monitoring is typically performed by web development teams and/or IT operations teams. However, as commercial-based API monitoring tool and solutions have gotten more user-friendly, it has opened to the door for different company departments to take advantage of, for example, marketing teams. For marketing teams, their interest lies in ensuring their web pages are always up, so when visitors are searching for their company’s products and services, the appropriate web page is displayed and functioning properly. Not only that, it is in also interest to also ensure any web applications, and related APIs that make those applications function, are also performing as intended.
How is API monitoring performed on websites?
API and website monitoring are very similar, but there are notable differences between the two. With website or web application monitoring, you can set alerts to ensure uptime, availability, and in the case of web applications, scripts to ensure applications are functioning as intended. A lot of applications rely on APIs, so in a sense, API monitoring monitors what is happing behind scenes, however, besides checking uptime and performance, API monitoring focuses on ensuring proper content is being sent and received when request is made, that authentication is working, validate single or multi-step HTTP requests, redirects, and more. And like website or web application monitoring, you will want a tool that can create a monitoring scenario or device that matches how actual users will access and use your services.
Is it hard to set up an API monitor?
Setting up API monitoring, especially with a paid, or commercial-based, tool is typically straightforward and easy to carry out. Like we had discussed earlier in this guide, commercial-based monitoring tools will already come with all the features, benefits, and support to easily create API monitors, whether they are SOAP-based, REST-based. Not only that, but you will also have access to many external monitoring locations, integrations with third-party tools, alerting options, scripting tools, etc. On the other hand, Open-source and free monitoring tools will usually require some programming expertise, which will naturally take little more time to create your API monitors, however, if you are comfortable with that, then you should not experience any issues.
What’s the difference between API monitoring and API testing?
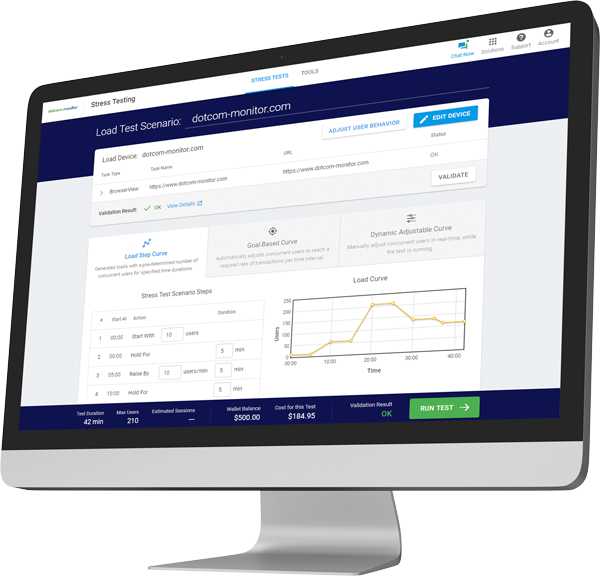
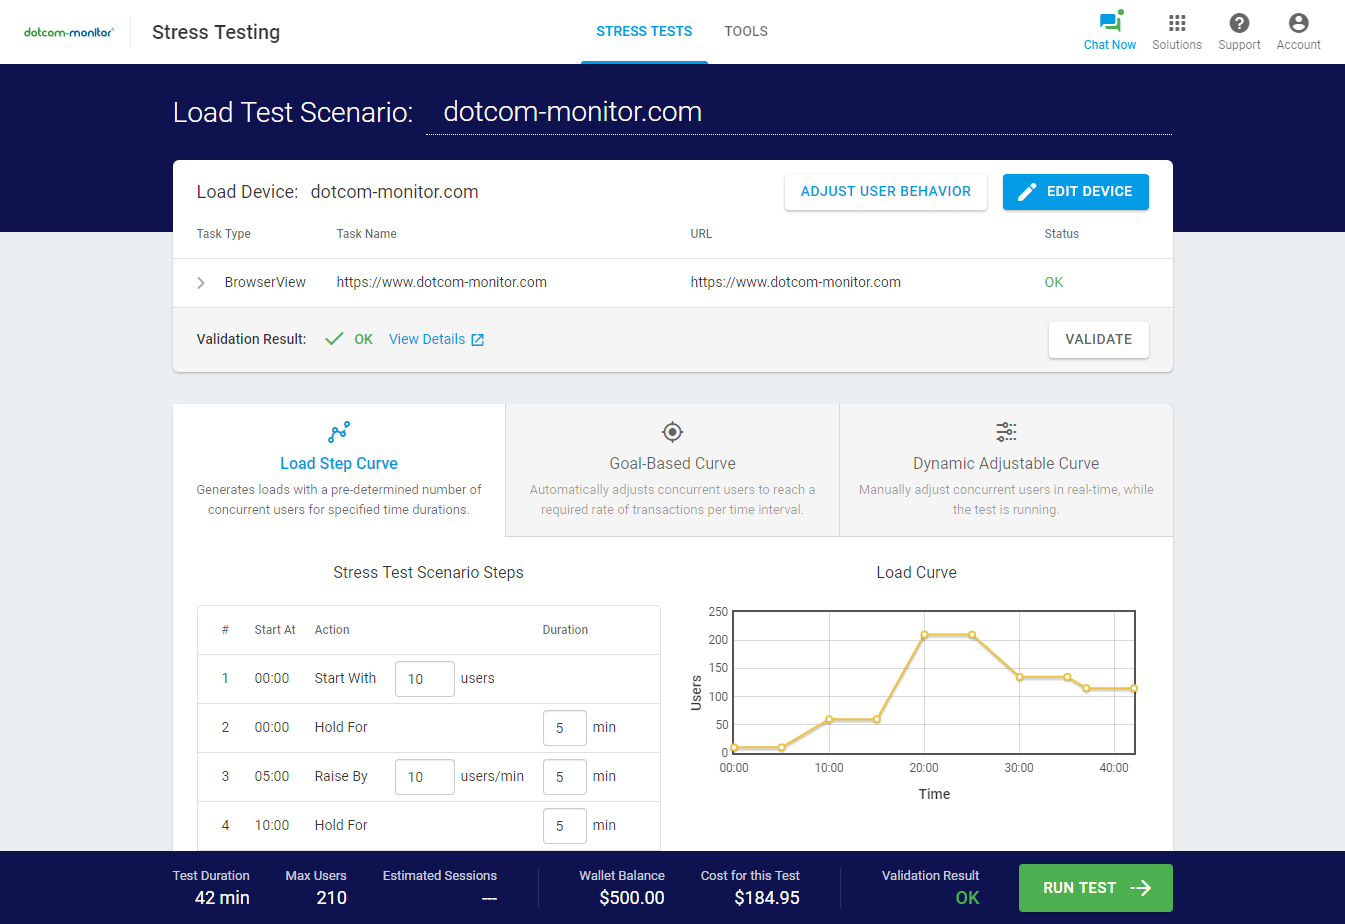
When it comes to talking about API testing and API monitoring, oftentimes, people lump them into the same basket. However, they are not the same thing. API testing is typically carried out in pre-production, and helps to validate API functionality, security, reliability, and performance. For developers, this means executing functional, unit, integration, end-to-end testing, and performance testing. Performance testing usually involves load or stress testing API once unit and functional testing has been complete. Dotcom-Monitor offers a load testing solution, called LoadView, that can be used to run performance tests on your APIs. LoadView utilizes the same interface and dashboard as Dotcom-Monitor, so users can easily add LoadView to their account. Once API tests have been completed and the APIs are pushed to production, you can set up continuous API monitoring to ensure ongoing performance.
Is it worthwhile to performance test my API?
If you have applications or APIs that are going to be accessed by hundreds or thousands of users or visitors, then it is necessary to performance test your APIs. You want to make sure that your application, and underlying data, or business logic and functionality, performs as intended against large volumes of concurrent users. When we typically think of testing, in terms of the perspective of the end user, a lot of the focus is put on the UI functionality, but the API layer is the go-between between the data and UI layer, so it is just as critically important to performance test.
How to you calculate API uptime/downtime?
Whenever an application, website, or API is down, it is never a good sign. Customers and visitors depend on all your services to always be up performing flawlessly. And if your application or API is directly tied to business or mission-critical applications, then the downtime can result in more serious consequences. When it comes to calculating downtime, a lot of it depends on how you set up your API monitoring device and what thresholds you set. For example, in the Dotcom-Monitor platform, API monitoring filters can be set by various criteria in response to an error, like number of minutes, agents, or tasks. So, the downtime begins once a filter’s criteria has been reached. Uptime is calculated or begins when the device is responding with success as it relates to errors, agents, and tasks, but does not meet the thresholds to throw a downtime error alert.
How do you benchmark API performance?
All organizations should want to know how their applications, websites, APIs, and other services compare to their competition. As consumers have more access to a variety of related services, products, solutions, etc., the differentiator between choosing between companies A, B, C, or D can come down to the user experience. Benchmark testing takes industry standards and compares it to how your organization meets or exceeds those metrics. In terms of API or application performance, that could mean ensuring all your systems are tuned to meet specific load times and response times, considering wait time, response time under load, requests per second, etc.
What is a good response time for a web-based API?
Depending on your API or application, response times are probably going to vary. Even more, your customers and visitors are accessing your services from different geographic locations, using different networks and devices. It is going to be difficult to ensure that response times are the same across the board, which is why API testing and monitoring is so important. If we consider statistics on user abandonment and web pages, studies have shown that if your website does not load within three seconds, they are likely to bounce. However, APIs do not have to deal with having to load the same components a web page does, like content, CSS, images, etc., so response times should be well under one second to avoid any perception of delays.
Should I use external or self-hosted API monitoring?
Determining if you need to use external versus internal API monitoring depends on a few factors. For example, if your APIs or applications are going to be accessible publicly and you expect a lot of visitors, then external monitoring is probably best suited for your needs. And it is important to set up API monitors from multiple locations. This way, you can determine how performance varies from region to region, as well as indicating if errors or performance issue are located to just a geographic location, or possibly affecting all locations. However, if your API is internal to your business and only accessible through your network, then a self-hosted API monitoring tool would probably be preferred. The great thing about modern monitoring solutions is that many provide private agents to monitor your internal sites, applications, and APIs.
Is it important to have alerting along with API monitoring?
While it is good practice to run the occasional manual performance and uptime checks on your applications, APIs, or pages, at some point you are going to want to automate this process, so it does not end up taking time away from your day job and you can focus on the next big development project. In addition to automating uptime and availability checks, you should set up alerts that go to the appropriate teams and stakeholders when issues arise. If you do not set up alerts, you will never know when an error occurs or performance thresholds are not met, which is the entire point of synthetic API monitoring. Let the robots do the heavy lifting!
Do AWS and Azure have built-in API monitoring tools or programs?
Cloud computing has come a long way in the last decade. Cloud computing provides the infrastructure, storage, software, and computing resources that an organization would typically have to purchase and maintain. By leveraging a cloud provider, this allows organizations to save costs on having to purchase and maintain physical hardware. Using services from a cloud provider like Microsoft Azure, AWS, Google Cloud, IBM Cloud, Oracle, etc., allows organizations a one-stop shop to develop, launch, and maintain and monitor their websites, applications, APIs, etc. These cloud solutions can also integrate with third-party tools that your teams may already use, so there is seemingly no end to the number of features that are accessible through these solutions.
What is the best API monitoring tool?
While there are many tools, open-source and paid, for API monitoring in the market today, we think that the best API monitoring tool is Dotcom-Monitor. The platform provides numerous features and benefits, like support for all the popular API protocols and technologies, the ability to monitor multi-step API calls, configure alerts, third-party integrations, access to 30 external monitoring locations, and 24/7 support. Dotcom-Monitor is completely web-based, so you do not have to worry about having to invest in any hardware or additional software. All of it is managed for you. Setting up an API monitoring device only takes a few minutes, and the solution walks you through the entire process. Additionally, if you want to set up monitoring for web applications and web pages, you can easily add those solutions as part of your overall monitoring strategy. The solutions are budget-friendly and can be paid on a monthly basis, so you are not locked into an annual agreement.
Next Level
Experience unparalleled features with limitless scalability. No credit card, no contract.
