
Polls open at 9 a.m. By 9:04 the support line is lighting up: the ballot page spins, login throws a 500, and a county clerk is on the phone asking why nobody can vote. The system was fine in testing. It was fine yesterday. It is not fine now, because yesterday it never had 18,000 people trying to submit a ballot in the same four minutes.
This is the failure pattern behind almost every voting-site outage. The traffic was predictable. The shape of it was not planned for. A government portal that comfortably serves a steady stream of license renewals can fall over the moment that same infrastructure has to absorb an entire voter pool arriving at once.
Load testing is how you find that ceiling before voters do. And online voting is one of the clearest cases for it, because the spike is sharp, the deadline is fixed, and there is no second chance to get it right. This guide walks through what breaks under voting load, how to build a test that matches a real vote, and the metrics that tell you whether you’ll make it through the day.
The short version: Online voting traffic is predictable in size but lands almost all at once, around an opening or a deadline. To test for it, build a load curve that mirrors that spike, script the full ballot flow in a real browser, and generate the load from the regions your voters live in. Then push past your expected peak so the breaking point shows up on a chart, not on vote day.
What’s Covered
- Why Voting Traffic Behaves Unlike Anything Else
- What Actually Breaks When a Voting System Gets Hit
- Where Online Voting Actually Runs
- How to Build a Load Test That Matches a Real Vote
- Three Scenarios From Real Vote Events
- Which Metrics Tell You You’ll Survive
- Best Practices for Testing a Voting System
- FAQ
Why Voting Traffic Behaves Like Nothing Else
Most web traffic spreads out. Even a busy retail site sees its visitors trickle in across the day, with peaks that build and fade over hours. A voting event does the opposite. It compresses a fixed, known population into a few sharp windows, and the timing is driven by human deadlines rather than by gradual demand.
Two moments do the damage. The first is when voting opens and everyone who has been waiting logs in together. The second, usually worse, is the hour before the deadline, when every procrastinator in the electorate shows up at once. Turnout that looked manageable as a daily total becomes a wall when most of it lands inside a 60-minute close.
And the volume is bounded but large. You know almost exactly how many people can vote, which is rare and useful. But that ceiling is also unforgiving: if 40,000 members are eligible and 30,000 vote, a meaningful slice of them will hit the system inside the final window whether your servers are ready or not. This is why scalability testing matters more here than for a typical site. You are not guessing at an open-ended audience; you are validating against a hard, countable peak.
The other complication is that a vote is not a single page view. A voter authenticates, loads a ballot, makes selections, often reviews a confirmation, and submits. Each step is a separate request, and the submit step writes to a database that has to stay consistent and auditable. So the real load is several times the headcount, and the heaviest part of it lands on the write path that you can least afford to drop.
What Actually Breaks When a Voting System Gets Hit
When a voting site goes down, the front end usually gets the blame because that’s what voters see. The actual failure is almost always deeper. Here is where the pressure lands, roughly in the order it tends to give way.
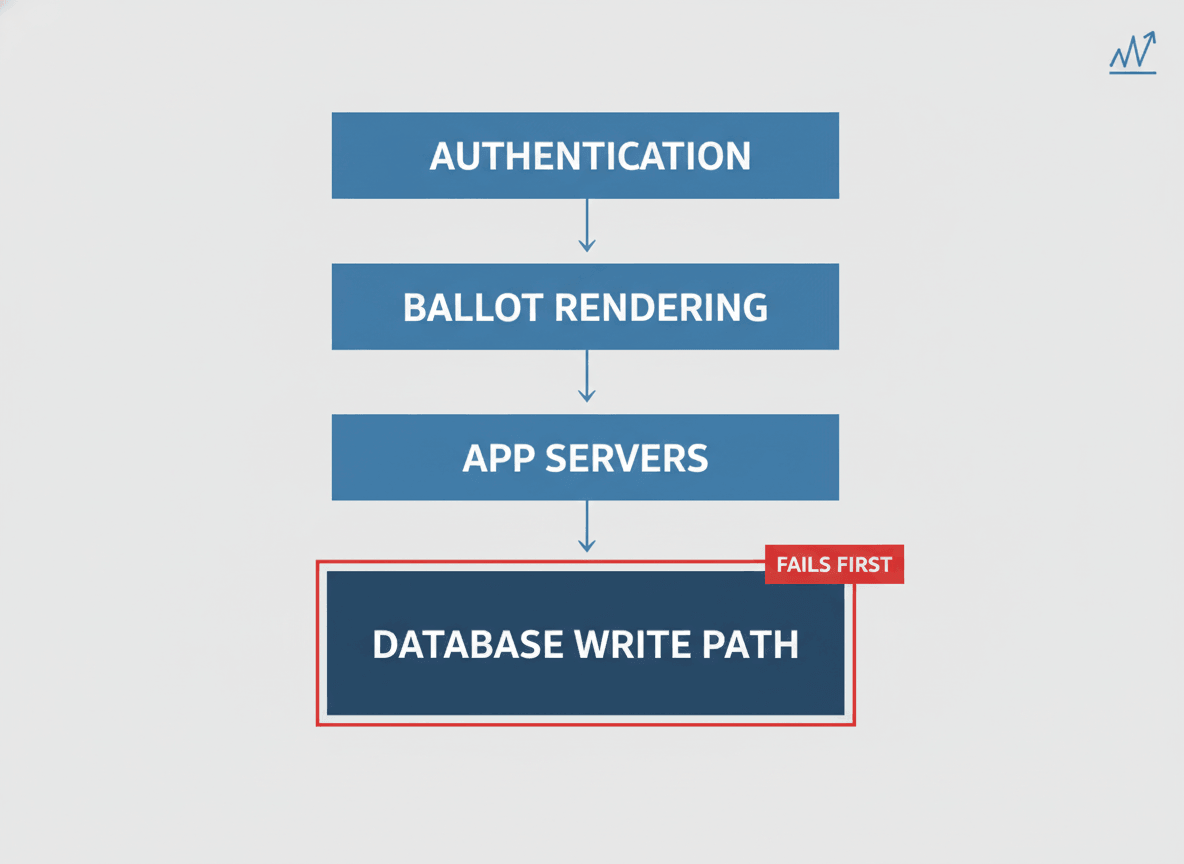
The database write path. Reads scale easily; writes do not. Every submitted ballot is a write that has to commit, stay consistent, and leave an audit trail. Under a synchronized rush, the connection pool drains, write locks pile up on the ballot tables, and transactions start queuing behind each other. This is the tier that most often takes a voting system down, and it’s invisible until you push real concurrency at it.
Authentication and session handling. Voters have to prove who they are before they can vote, and that check often calls an identity provider or a voter-registration lookup. When thousands authenticate in the same minute, that dependency becomes the bottleneck. The ballot pages might be fine; people just can’t get to them.
The CDN can’t save you. A content delivery network caches static assets, so the logo and stylesheet load fast. But a ballot is personalized and a vote submission is dynamic, so none of the requests that matter can be served from cache. The traffic that breaks things goes straight to your origin servers no matter how good the CDN looks.
Autoscaling reacts too late. Cloud autoscaling responds to load after it appears, and new instances take a minute or two to boot and warm up. A voting spike arrives faster than that. By the time capacity catches up, the deadline rush is already over and the errors have already gone out. Validating your capacity planning ahead of time is the only way to know your scaling rules fire fast enough, or that you’ve pre-provisioned enough to skip the lag entirely.
None of these show up under light testing. They surface only when you reproduce the concurrency of a real vote, which is the whole point of running a proper load test instead of a smoke check.
Where Online Voting Actually Runs
Online voting covers more ground than most people picture, and it helps to be precise about it. Binding government elections at the national level remain a contested, security-driven debate, and that’s a separate discipline from the one this guide is about. Performance readiness and election security are both real, and neither one substitutes for the other.
Where online voting is already routine is everywhere below that line. Union ratification votes. Shareholder proxy voting at annual meetings. University and student-government elections. Homeowner and co-op board elections. Professional-association and credentialing-body votes. And on the public side, participatory budgeting portals, public-comment systems, and town-hall input tools where a community weighs in on a decision within a set window.
Every one of those shares the same traffic signature: a known, bounded population and a hard deadline that pulls most of the load into a narrow window. That’s why the same testing approach applies across all of them, and why government teams running public-input portals face the same spike problem an enterprise faces during a shareholder vote. LoadView’s work with public-sector teams sits here, in government performance testing for the portals and services citizens actually log in to use.
How to Build a Load Test That Matches a Real Vote
A load test is only worth running if it reproduces what a real vote does to your system. That means matching three things: the shape of the spike, the steps a voter actually takes, and where those voters come from. Get those right and the numbers mean something. Skip them and you’ve tested a fantasy. And because LoadView runs the load from a fully managed cloud, the work goes into building the test, not standing up servers to generate the traffic.
Match the Spike, Not the Average
Start from your eligible pool and your turnout history, then build a load curve that mirrors the close. If past votes show 70% of ballots landing in the final two hours, your test should ramp hard into that window rather than spreading users evenly. LoadView gives you three load curve options for this: a load step curve to drive a set number of concurrent users into a sharp peak, a goal-based curve to validate that you can hit a target concurrency, and a dynamic curve you adjust in real time to probe where things start to bend.
Then test past your expected peak. If you think 18,000 people vote in the closing hour, run the test at 22,000 or 25,000 and watch where it breaks. You want the breaking point on a chart in front of you weeks early, not as a live discovery on vote day. This is also the line between a load test and a stress test: the first confirms the expected peak is safe, the second finds the wall.
Script the Whole Ballot, Not Just a Page Load
Hitting the ballot URL with a flood of requests tells you almost nothing, because a real voter does far more than load one page. They log in, render a personalized ballot, make selections, review, and submit. To reproduce that, record the full journey in a real browser with point-and-click scripting using the EveryStep recorder, so every virtual voter walks through the same authentication, the same dynamic ballot rendering, and the same write on submit.
This is where real-browser testing earns its place over protocol-level scripts. Modern voting interfaces lean on JavaScript, single-page frameworks, and client-side validation. A protocol-only test never executes any of that, so it under-reports the real load and misses front-end bottlenecks entirely. Driving actual browsers through the ballot is the only way to see what a voter’s session truly costs your infrastructure. For the heavier interfaces, running this through web application load testing keeps the client-side work in the measurement instead of pretending it’s free.
Spread the Load Across Real Geography
Voters in a national union or a multi-state association don’t all connect from one data center. They come from everywhere, across different networks and distances, and that affects latency and the way load hits your regional infrastructure. Generating traffic from a single source hides all of that. Using geo-distributed load injection from the regions your voters actually live in produces results that match what people will really experience, instead of an average that no individual voter ever sees.
One more reason to distribute: generating all your load from a single IP can trip rate limiting or bot protection, which throttles your own test and hands you numbers that look better than reality. Traffic from many addresses and locations behaves like a real electorate and gets you a truthful answer.
Three Scenarios From Real Vote Events
The patterns above aren’t abstract. Here is how they show up in three kinds of vote events teams actually run, with the details generalized.
The Union Ratification Deadline
A national union puts a contract to a ratification vote with a hard midnight close. Turnout creeps along for two days, then 60% of the 50,000 eligible members vote in the last three hours as the deadline and a final email reminder collide. The write path is the risk here: tens of thousands of ballot submissions concentrated into a short window, each one a database commit that has to hold. A load test that ramps into that midnight wall, with virtual voters scripted through the real login-and-submit flow, shows whether the database connection pool survives the close or starves halfway through.
The Municipal Participatory Budgeting Portal
A city lets residents vote online on how to spend part of the local budget, promoted through social posts and local news. The traffic is spikier and harder to predict than a closed membership vote, because a single news segment can drive a surge with no warning. Here the test focuses on a steep, sudden ramp and on concurrent user testing at levels above the city’s best turnout guess, since the downside of an undersized estimate is residents locked out of a public process.
The Shareholder Annual Meeting
A public company runs proxy voting that closes minutes before the annual meeting starts. The peak is small in headcount but unforgiving in timing, because a missed vote at an AGM has legal weight and there is no extension. The test models a tight pre-meeting crush and watches authentication closely, since institutional shareholders often vote large blocks through integrations that hit the identity layer harder than individual logins do.
Different events, same lesson. The total turnout was never the problem. The concentration of it was, and only a test shaped like the real spike surfaces that in time to fix it.
Which Metrics Tell You You’ll Survive
A load test produces a lot of numbers. These are the ones that decide whether you’re ready, and the question each one answers. For the full picture, LoadView reports break these down across the run, but start by watching load testing metrics in this order.
| Metric | What It Tells You | Why It Matters for a Vote |
|---|---|---|
| Error rate | Share of requests that fail or time out | A failed request is a voter who couldn’t vote. This is the number that defines an outage. |
| Response time (95th / 99th percentile) | How slow the worst experiences get, not the average | Averages hide pain. The 99th percentile is the voter staring at a frozen ballot at 11:58 p.m. |
| Throughput | Requests and completed ballots per second | Shows whether the system keeps clearing work as fast as voters submit it, or falls behind. |
| Concurrency at first failure | The user count where errors start climbing | Your real capacity ceiling. Compare it to your expected peak and judge the gap. |
| Time to first byte | How long the server takes to start responding | An early warning. TTFB climbs before outright errors do, so it flags strain ahead of failure. |
Read them together, not in isolation. A low average response time means nothing if the error rate is climbing and your 99th percentile has blown past ten seconds. The combination that says “ready” is a flat error rate, percentile response times inside your acceptable range, and throughput that keeps pace with submissions all the way through your modeled peak.
Best Practices for Testing a Voting System
Most of what separates a useful voting-system test from a checkbox exercise comes down to a handful of habits.
Test against a production-like environment. A test on an undersized staging box tells you about the staging box. Mirror production capacity, configuration, and data volume as closely as you can, and use test ballots and test voter records that get cleared before the real vote so you exercise the real code paths without recording a real vote.
Test early, then test again. Run the first load test weeks before the vote, while there’s still time to fix what it finds. Then re-test after any change to the ballot, the infrastructure, or the auth flow, because the fix for one bottleneck routinely exposes the next one downstream.
Include the dependencies you don’t own. Identity providers, payment or verification services, and registration lookups all sit in the voting path and all have their own limits. If your test skips them, it skips the bottleneck most likely to surprise you. This is the same pattern teams hit when they load test government websites and applications that lean on shared back-end services.
Plan for the close, not the open. Capacity that survives the opening rush can still fail at the deadline, because the deadline peak is usually higher and arrives with a reminder email attached. Shape your heaviest test around the close.
Have a fallback for when you’re over the ceiling. If testing shows turnout could exceed your safe concurrency, a virtual waiting room holds voters in an orderly queue instead of letting the site collapse. It’s worth load testing that virtual waiting room too, since a queue that breaks under pressure is no better than no queue at all.
See Your Voting System’s Real Ceiling
Find the breaking point on a chart, weeks before polls open. LoadView drives real browsers through your full ballot flow, from the regions your voters actually live in, at the concurrency a real vote produces. No infrastructure to stand up, no credit card to start.
FAQ
Common questions from teams sizing a voting system for its peak.
How Many Concurrent Users Should a Voting System Load Test Simulate?
Size the test to your eligible voter pool, not your average traffic. If 40,000 people can vote and history shows most cast their ballots in the final two hours before a deadline, model a peak that pushes a large share of that pool through the ballot flow inside a short window. Test past your expected peak so you find the breaking point with headroom to spare, not on the day itself.
Why Do Online Voting Systems Crash When Traffic Is Predictable?
Voting traffic is predictable in volume but brutal in shape. Everyone arrives in the same short window around an opening or a deadline, so the load is synchronized rather than spread out. Systems sized for average traffic run out of database connections, write capacity, or session headroom when that synchronized rush hits, and the site returns errors or times out.
Can You Load Test a Voting System Without Affecting Real Ballots?
Yes. Run load tests against a staging or pre-production environment that mirrors production, or use test ballots and test voter records that are cleared before the real vote. The point is to exercise the same code paths, database writes, and authentication steps a real voter triggers, without recording any real vote.
What’s the Difference Between Load Testing and Stress Testing a Voting System?
Load testing checks whether the system holds up under the traffic you expect on vote day. Stress testing pushes past that point to find where it breaks and how it fails. For voting systems you want both: confirmation that the expected peak is safe, plus a clear picture of the failure mode if turnout runs higher than planned.