Powerful Load Testing for
Websites, Web Apps & APIs
Industry Leading Load Testing Features
Powerful features to simplify the complexities of load testing.
Custom Load Curves
Point & Click Scripting
Easily create scripts to simulate client-side interactions with your websites and applications with the EveryStep Web Recorder by LoadView. Supports over 40+ desktop/mobile browsers and devices.
Custom Load Curves
Point & Click Scripting
Easily create scripts to simulate client-side interactions with your websites and applications with the EveryStep Web Recorder by LoadView. Supports over 40+ desktop/mobile browsers and devices.
Detailed Performance Reports
Gain insight into performance metrics that are vital. View your test execution in real-time to see a graphical representation of the execution plan, average response times, and errors that occur.
Geo-Distributed Network
Test performance around the globe. Initiate load injector servers from over 40 zones around the world including the United States, Canada, South America, Europe, and APAC.
Detailed Performance Reports
Gain insight into performance metrics that are vital. View your test execution in real-time to see a graphical representation of the execution plan, average response times, and errors that occur.
Geo-Distributed Network
Test Behind the Firewall
For organizations that restrict incoming connections from outside the network firewall, LoadView provides two methods of performance testing from within your firewall.
Test in Real Browsers
LoadView uses real browsers to highlight your site’s performance under load—from a user’s perspective. Using popular browsers like Chrome and Firefox, LoadView is more accurate than headless emulators.
CI/CD Integrations
Automate load testing seamlessly within your CI/CD pipelines with LoadView’s powerful integrations. From Azure DevOps to Jenkins and CircleCI, you can ensure every deployment delivers peak performance with minimal effort.
CI/CD Integrations
Automate load testing seamlessly within your CI/CD pipelines with LoadView’s powerful integrations. From Azure DevOps to Jenkins and CircleCI, you can ensure every deployment delivers peak performance with minimal effort.
The following technologies are supported by LoadView:

Prepare for Real Traffic
Define the number of users, user behavior, and duration through custom-built scenarios.

Define Tasks
User Behavior
Simulate common user page interactions by setting normal or custom delays for your load testing scenario.
Geo-Distribution
Load Test Behind the Firewall
LoadView provides dedicated static IPs that can be whitelisted and configured in advance, allowing you run regular tests for target resources behind a firewall.
Video Recording
The website or web application rendering steps are captured via video recording and available for further review and analysis.
Reference Server
The reference server represents a single virtual user, or external visitor, which examines device availability during a test. This reference data is used as a baseline against the full test results.
Detailed Waterfalls
Drill-down even further into more details with our waterfall charts. These charts provide a breakdown of every single element that loaded on a page during a test.
Dynamic Variables
Upload a file containing specific dynamic variables that can be used as part of your stress test. For example, a list containing different usernames and passwords can be used to log into and test portals under load.
Load Injector Control
Customize the number of load injector servers used by adjusting the number of virtual users per server.
Flexible Pricing Models
Select from pre-configured monthly or annual subscription packages, or a one-time pay as you go on-demand test.
Flexible. Scalable. Powerful.
All from one convenient load testing solution.
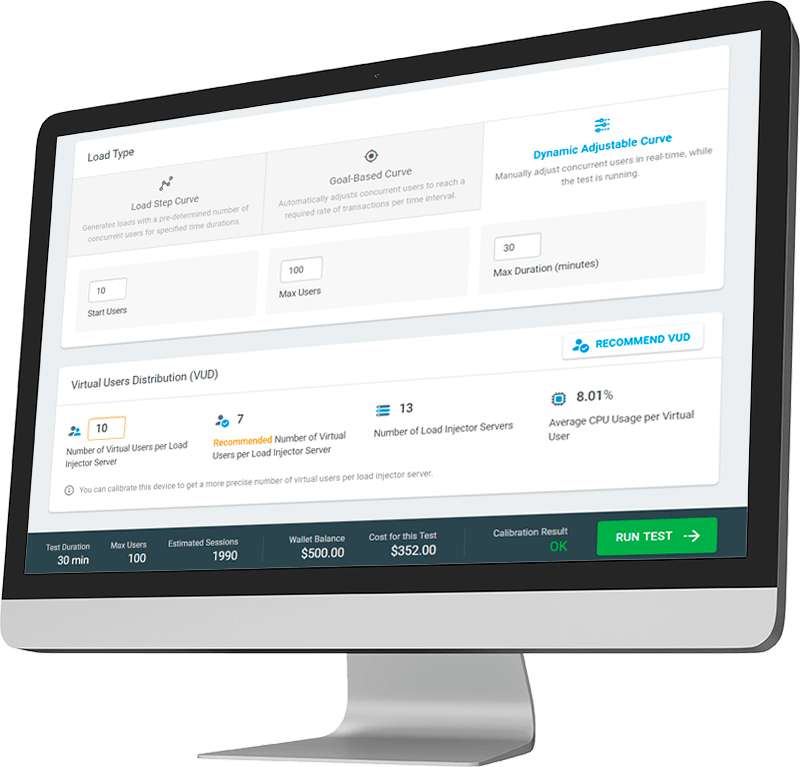
3 Unique Load Curves
Point-and-Click Scripting
Geo-Distributed Network
Performance Reports
Flexible Performance Testing for DevOps
LoadView empowers Agile teams with the flexibility to design multiple test scenarios for today’s most complex applications.
Load Step Curve
Determine if your website can handle spikes in traffic by generating load with a set number of concurrent users over a specified time period.
Goal-based Curve
Ensure your website can handle expected increases in user traffic. Validate capacity plans and SLAs in production environments.
Dynamic Adjustable Curve
Test the limits of your infrastructure by adjusting load in real-time. Gain insight into how websites or applications change as load levels fluctuate.
Next Level
Experience unparalleled features with limitless scalability. No credit card, no contract.