Performance Data that Matters
Performance Data that Matters
Gain insight into performance metrics that are vital for your organization’s capacity planning.
Detailed element-level statistics to executive summaries.
Watch how virtual users interact with your applications and sites in real-time.
Access and share detailed reports after test completion.
View your test execution in real-time to see a graphical representation of the execution plan, average response times, and errors that occur. When a test has finished, the results can be accessed through the Stress Test Report, which contains the following sections:
Summary
Includes summary of the execution plan, including maximum, actual, and expected number of virtual users, along with average response time of transactions, number of sessions, session errors, load injector CPU usage, and much more.
Session Report
Drill-down even further into element-level details through waterfall charts. Analyze start time, duration, and execution status for all user sessions or zones, as well as any client-side errors and failed sessions.
The Session Report also includes the Reference Server recording. The Reference Server runs a single virtual user that represents an outside visitor, examining device availability during the test. This allows you to compare load injector sessions and the reference user during a stress test. For web applications and web page load tests, the reference server records video in the way it appears to your visitor, allowing you to review actual behavior of your applications and sites under load.
Device Info
Overview of the script that was executed, the dynamic variables (if applicable), and any profile details, such as user behavior and delays.
- Execution Plan
- Transactions Per Minute
- Average Response Time
- Cumulative Sessions Count
- Number of Sessions Started
- Number of Errors by Errors Type
- Load Injector Load
- Infotip

Execution plan
The line chart shows the change in the actual number of virtual users over the testing period vs. the expected number of virtual users based on the test scenario. If the Actual Number of Users line reaches the Max.Number of Users line, all virtual users allocated for the test were used and the site was tested under the planned maximum load.

Transactions per minute (Goal-Based Load Test only)
The chart reflects goal vs. actual number of transactions per minute at each test iteration.
On the chart you can find the following lines:
- Transactions (Planned) – the goal number of transactions per minute set in the test scenario.
- Transactions (Actual) – the actual number of transactions simulated on the target website at each iteration. The line is separated with the calibration periods.
- Calibration periods – a time needed to reach the next level of user load. On the chart, it is displayed as a dimmed gap between actual load periods.
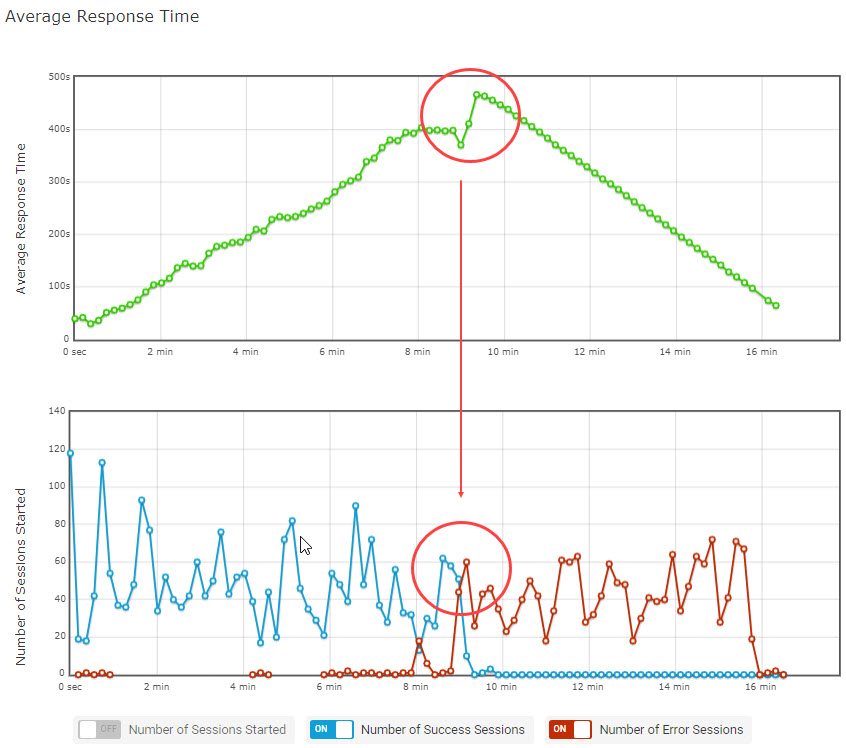
 Average Response Time
The Average Response Time chart shows the change in the actual duration of transactions. The Y-axis represents the time in seconds. If there are no significant line fluctuations on the chart, your web site handled the test load successfully.

Cumulative Sessions Count
The Cumulative Sessions Count graph shows the total number of sessions started over the test. The chart allows assessment of the total number of virtual users simulated on the target resource over the test period. The Y-axis shows the number of sessions.
Each node represents the total count, calculated as a sum of sessions started by the time of calculation.
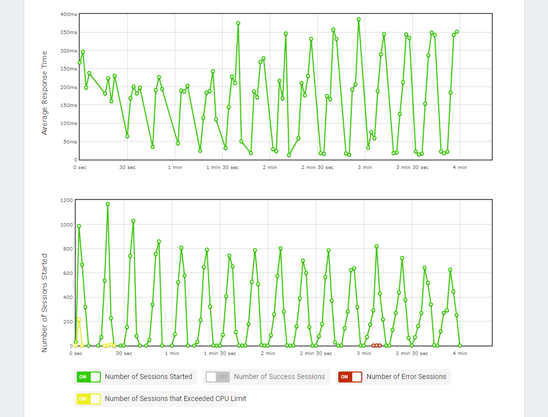
 Number of Sessions Started
The Number of Sessions Started chart allows comparing the total number of sessions started by concurrent users and the number of failed/successful sessions.
On the chart you can find the following lines:
- Number of Sessions Started – the total number of sessions started at a particular time interval.
- Number of Success Sessions – the number of sessions that were run without errors, i.e., all tasks of the device were executed successfully.
- Number of Error Sessions – the number of sessions with failures (no keywords/image found, failed to access the target resource, etc.).
- Number of Uncompleted Sessions – the number of sessions that were aborted automatically at the end of the test duration time.

Number of Errors by Errors Type
The Number of Errors by Errors Type dot chart illustrates the number of error sessions by error type. The number is specified on the Y-axis.
Use the chart to determine which error types predominated during a specific moment. See the Session Report to review failures. For error description, check Error Codes.

Load Injector Load
The chart shows CPU load metrics received from Dotcom-Monitor LIs. Use it to assess how your test affects the performance of LIs running the test from different geographical zones.
Make sure LIs load levels are not higher than 80%. Based on our expertise, the optimal CPU load for the Load Injector Server machine is 80% or less. This load level excludes the server hardware delays that influence the server performance and slow down data processing.
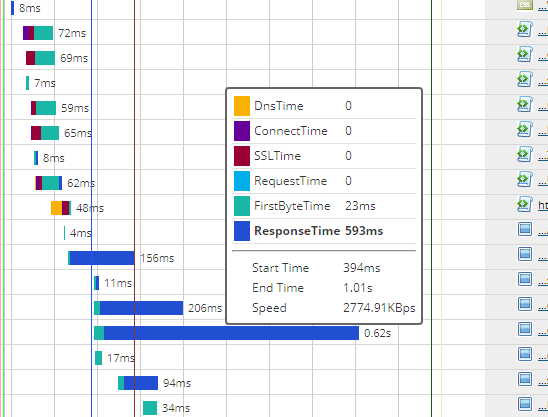
 Infotip
Nodes on the charts are active, so clicking a node will open its infotip. To see detailed information for the node-related sessions, click Show Details at the bottom of the infotip. The report for sessions running at the selected period of time will be displayed on the Log page.
What are you looking to accomplish? The choice is yours!
Validate SLAs
Validate how well your SLAs meet performance under actual user behavior.
Manage Traffic Spikes
Ensure your websites and applications can handle a concentrated spike in traffic.
Validate SLAs
Validate how well your SLAs meet performance under actual user behavior.
Mange Traffic Spikes
Ensure your websites and applications can handle a concentrated spike in traffic.
Simulate Real-World Conditions
Simulate and reproduce real-world conditions to ensure exceptional performance in production environments.
Plan for Future Capacity
Ensure your infrastructure can scale to meet user demand today and for the future with LoadView’s Postman testing tools and Selenium.
Simulate Real-World Conditions
Simulate and reproduce real-world conditions to ensure exceptional performance in production environments.
Plan for Future Capacity
Ensure your infrastructure can scale to meet user demand today and for the future with LoadView’s Postman testing tools and Selenium.
Globally Distributed Load Testing from the Cloud
Test and understand the impact of network and location on load and performance of your infrastructure.
Globally Distributed Load Testing from the Cloud
Test and understand the impact of network and location on load and performance of your infrastructure.
Flexible, On-Demand Load Testing for Any Application
Test and improve the performance of websites, web applications, and web services/APIs with LoadView.
Websites
Test the limits of your website and ensure that the customer experience is consistent across all popular desktop/mobile browsers and devices.
Web Applications
Measure client-side performance by simulating the critical user interactions of your web applications to improve the user experience.
Web Services / APIs
Perform thousands of calls to your APIs the same way your end users and use dynamic API testing tools on virtually any type of system or infrastructure.
in Minutes
On-demand. No credit card. No contract.