In our earlier article, Web Load Testing: JMeter vs. LoadView – Real-World Scenario, we demonstrated how to simulate a typical user journey on PhoneNumberMonitoring.com — launching the site, logging in, navigating tabs, and logging out — using both Apache JMeter and LoadView. We highlighted the fundamental differences in scripting effort, setup complexity, and overall ease of use between these two tools.
Building upon that exercise, this article presents a detailed comparison of the performance reports generated by LoadView and JMeter after executing a load test with 10 users. We focus on critical aspects like execution accuracy, real-time reporting capabilities, AJAX and dynamic content handling, session visibility, and enterprise scalability.
As modern applications increasingly rely on dynamic JavaScript execution, evaluating user experience through real browser-based testing becomes essential. This comparison aims to showcase how each tool reflects these real-world challenges and which one provides deeper, more actionable insights into front-end performance.
- Reporting Capabilities: Static vs Dynamic Insights JMeter:
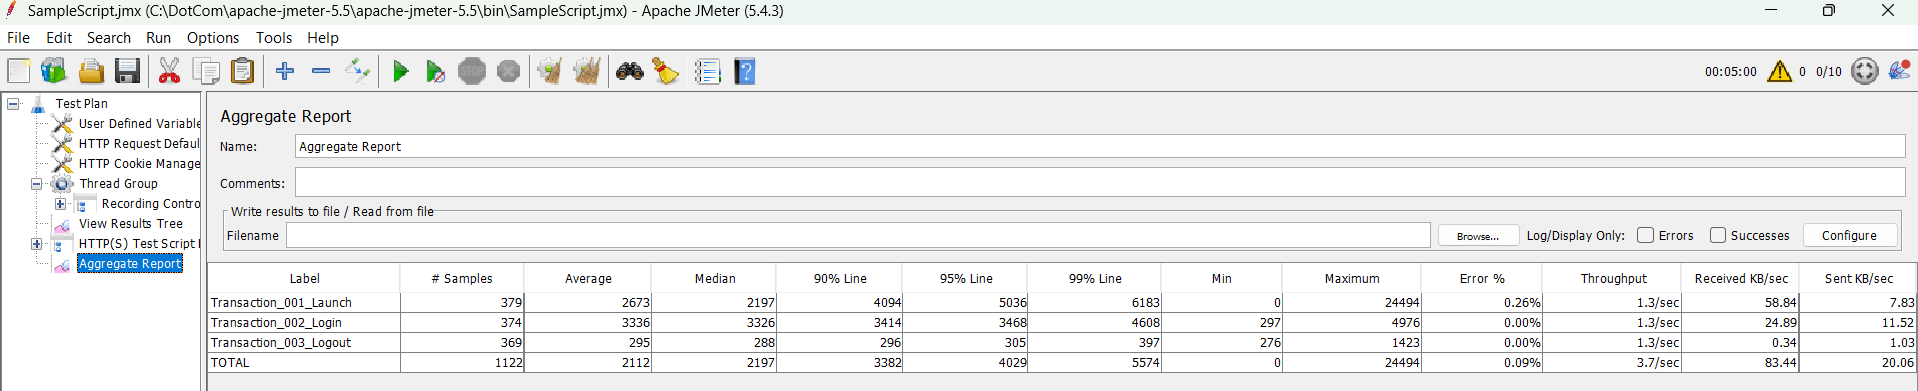
Offers core performance stats via listeners like Aggregate Report and Summary Report: JMeter’s built-in listeners provide high-level metrics such as average response time, throughput, and error percentages. However, these outputs are limited in granularity and lack visualization for complex user journeys.
Requires user scripting or plugins for historical comparisons: To analyze trends over time, testers must manually configure integrations with databases like InfluxDB and visualization tools like Grafana, adding complexity.
Generates local HTML or CSV files that are not cloud-shared: Reports are stored locally, requiring manual sharing and coordination, often creating versioning and accessibility challenges.
No built-in drill-down to individual user sessions: Testers cannot trace issues at a session level; they must manually cross-reference timestamps in logs.
GUI Mode:
Non GUI mode:
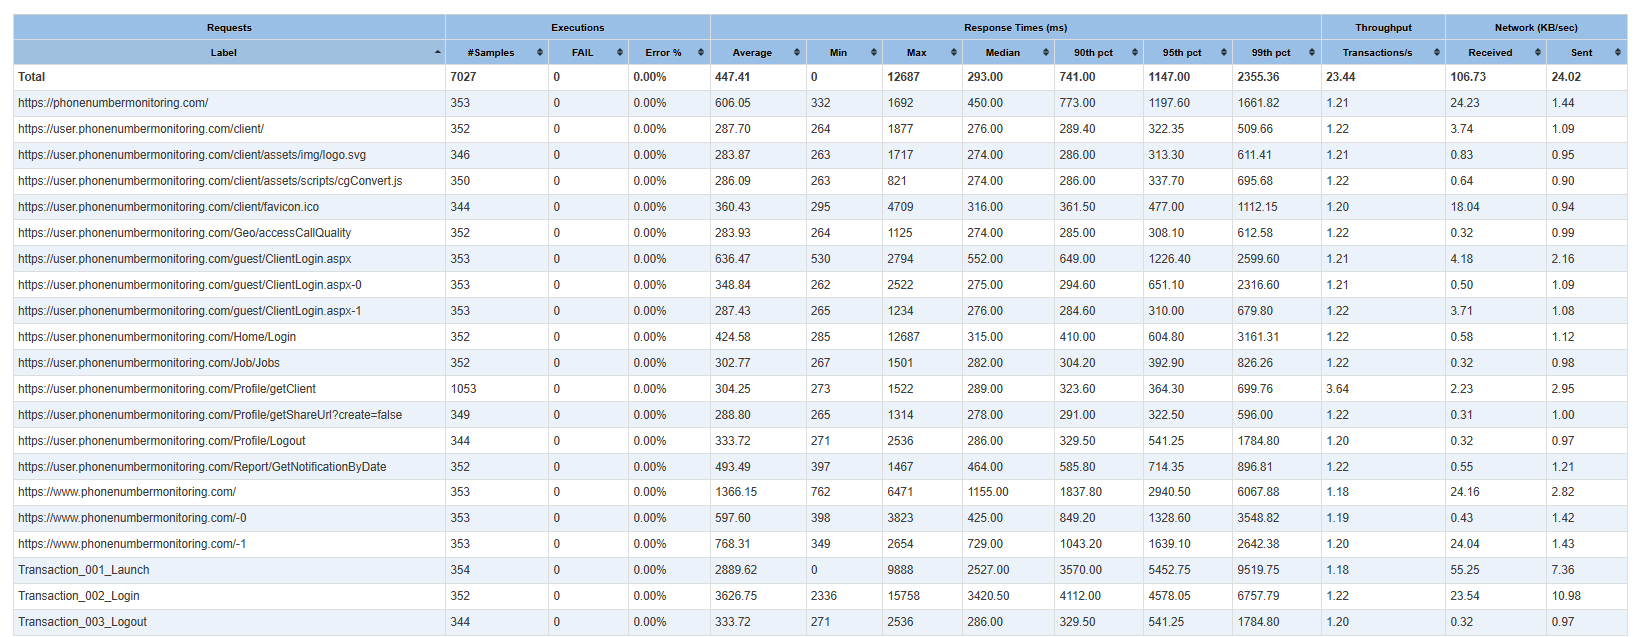
LoadView:
Rich, cloud-hosted reports accessible in real-time: Live performance metrics are displayed continuously as the test runs.
Continuous real-time update of performance KPIs: Metrics such as average response time, 90th percentile, minimum, maximum, and failure rate update in real time.

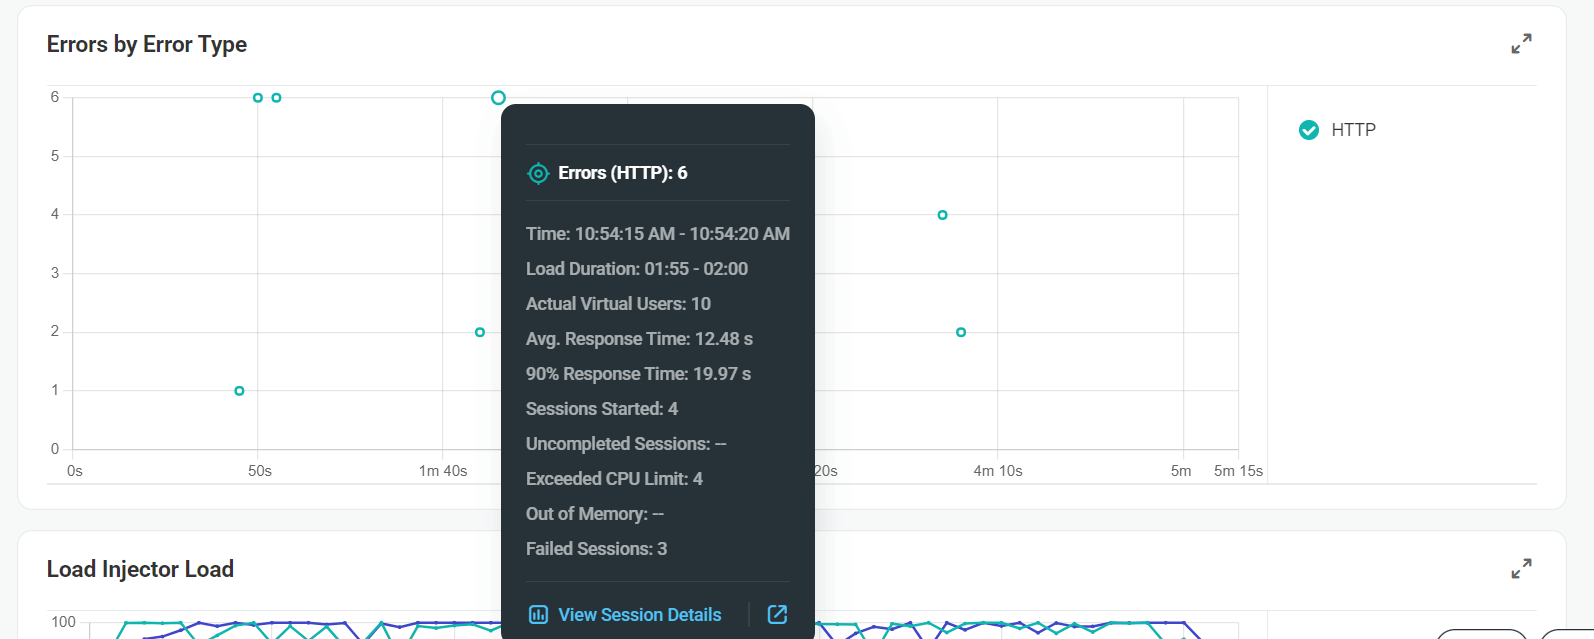
Error classification for quicker root cause analysis: Errors are grouped into validation, client, server, and third-party categories.
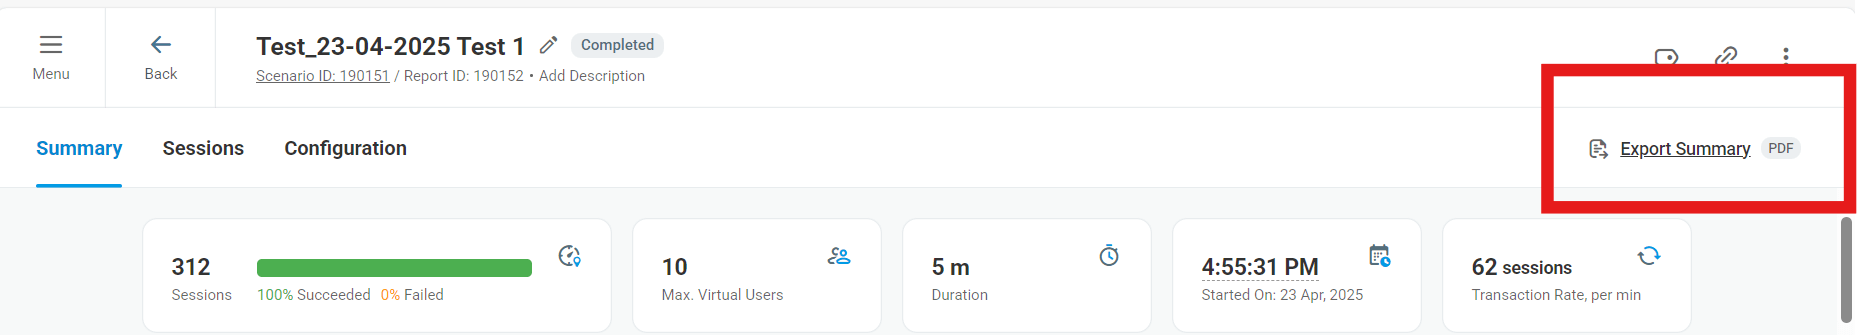
Cloud-based PDF and shareable dashboard links: Easily distribute live dashboards or export summaries to share with teams.
Interactive charts for response times, error distribution, and virtual user activity: Enables quick identification of spikes, trends, or failures. A comprehensive summary view to monitor test progress in real-time.
The top half shows a sudden spike in average response time, which correlates (see red arrows) with a drop in successful sessions and rise in failed sessions (bottom graph). This is an ideal example of LoadView’s ability to visually correlate performance degradations with user session behavior

Cumulative session tracking across time windows: Helps assess test consistency and stability throughout the execution period.
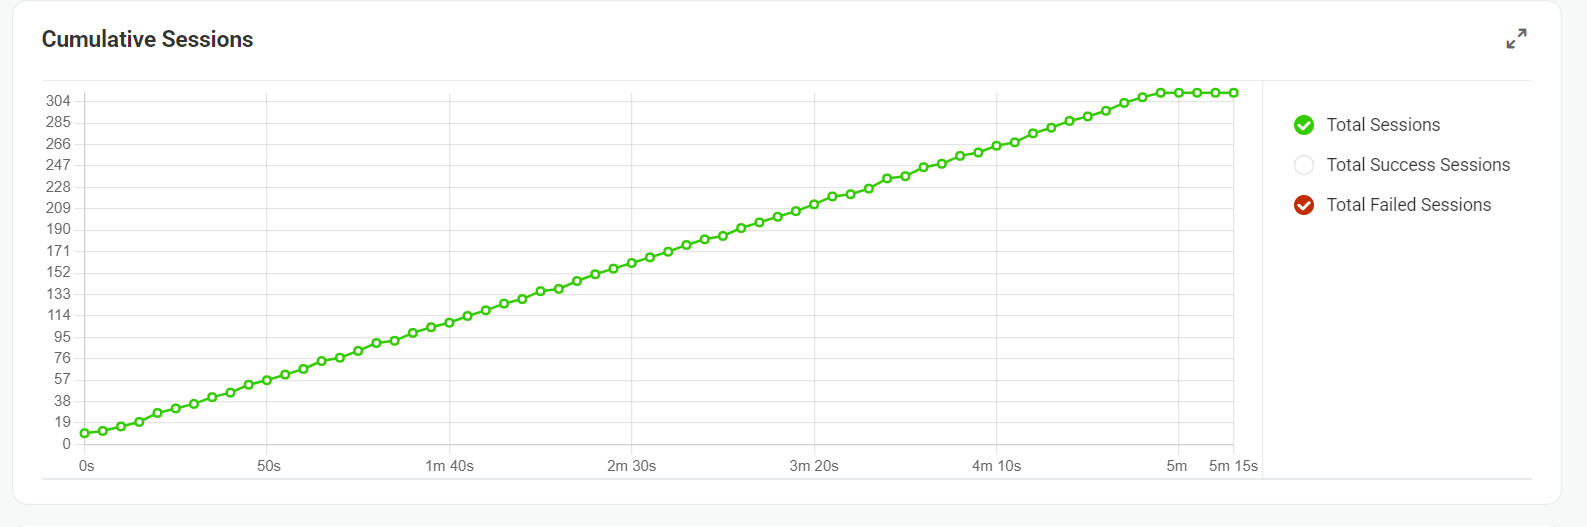
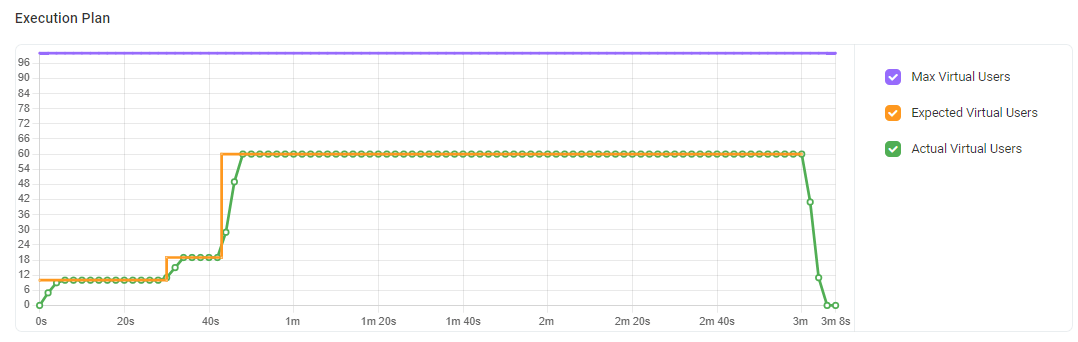
Virtual user ramp-up curves: Visual representation of load increases aligned with session performance.
This graph displays how virtual users were scaled over time. The green line shows the actual number of users executed, closely matching the orange line (expected users), proving stable ramp-up and ramp-down behavior. The purple line marks the maximum configured limit for virtual users.
Server statistics from each geo-zone: Diagnose region-specific issues or latency. Session-wise navigation showing individual user journeys: Drill into any virtual user’s path and associated response data.
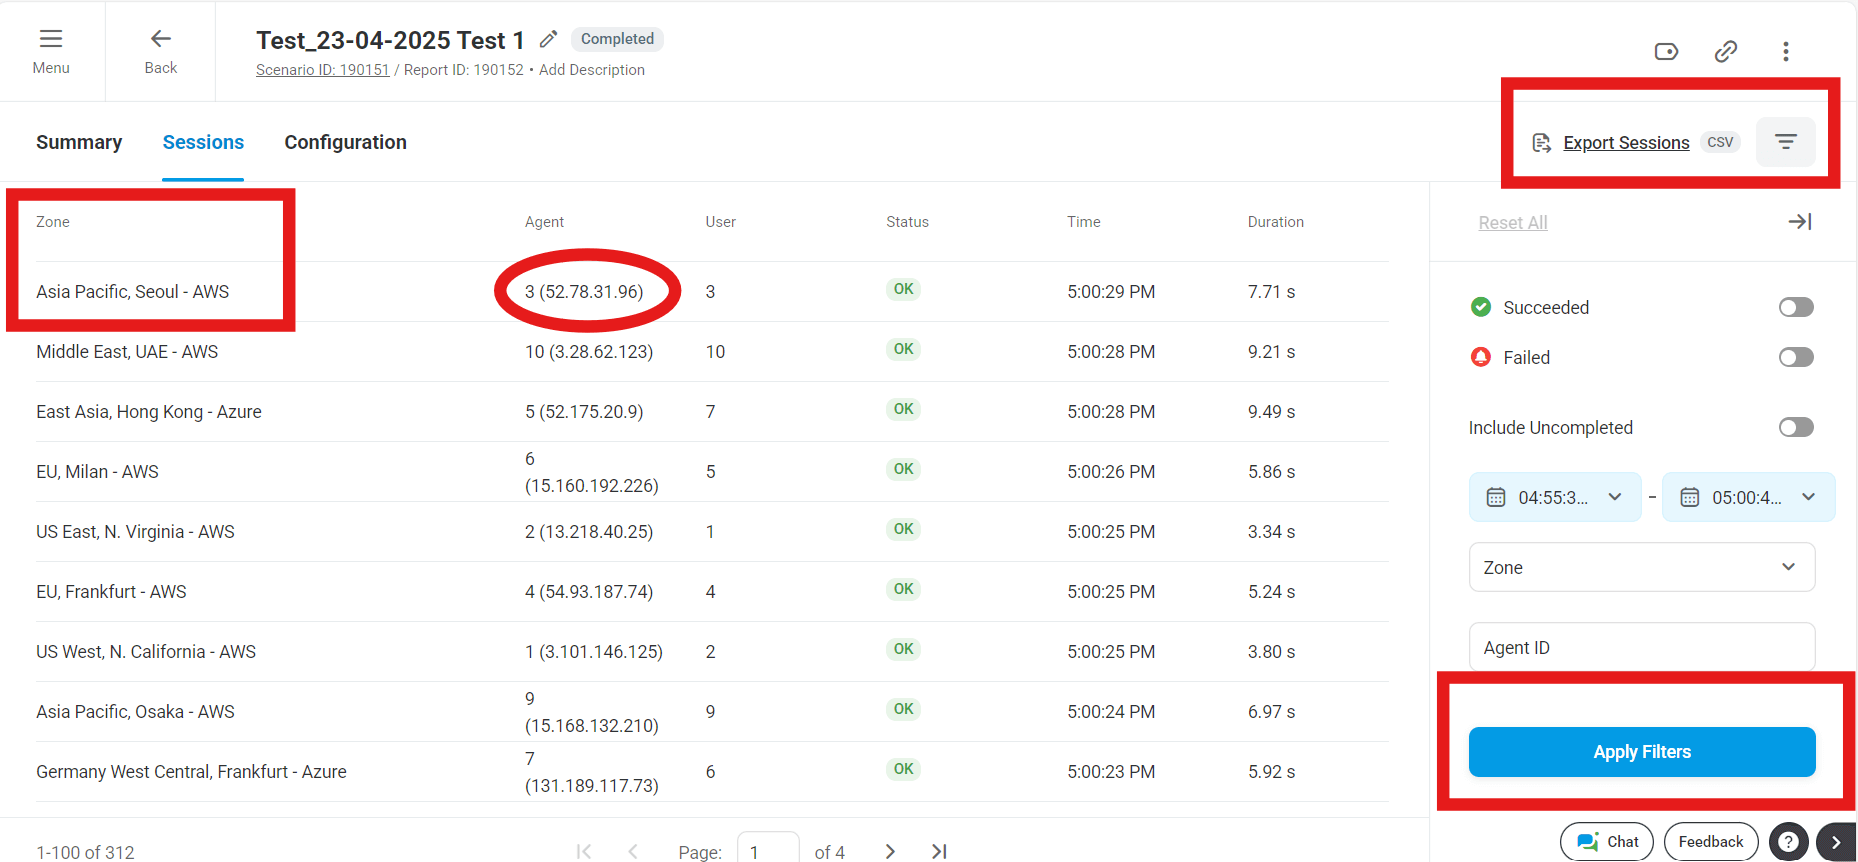
Drill into specific session IDs: Inspect individual test journeys and can see Detailed network-layer insights per user and Rapidly isolate the source of errors for quicker resolution.
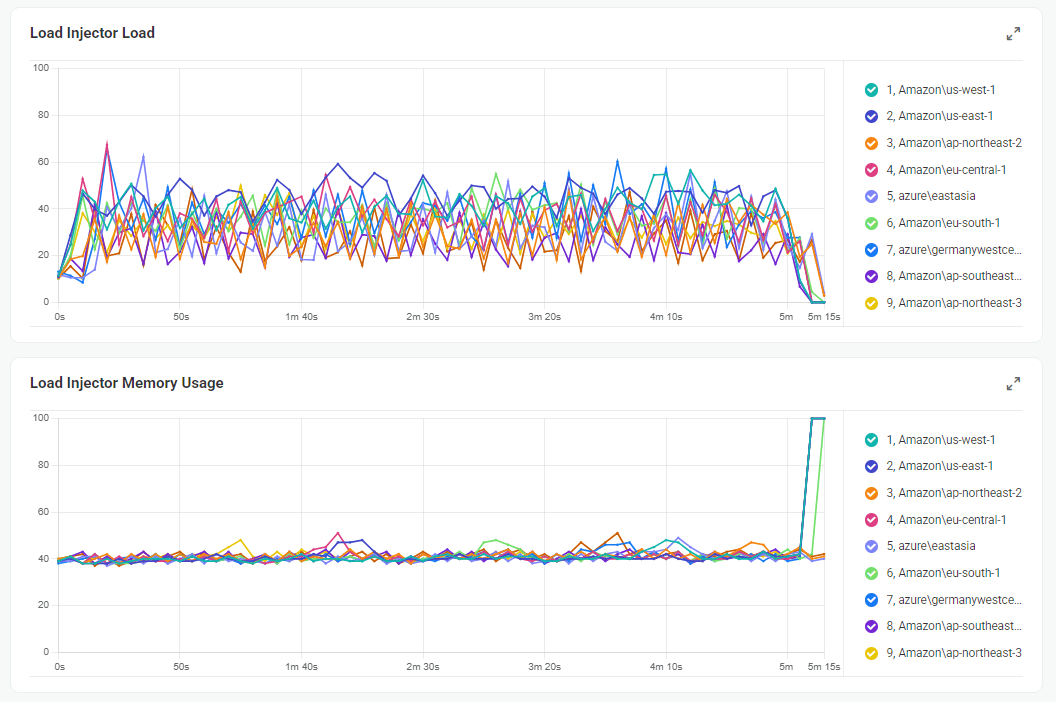
This shows how multiple cloud agents (from AWS, Azure regions) shared the test load. The CPU and memory remained mostly balanced throughout, verifying LoadView’s elastic test distribution architecture.
- AJAX and Asynchronous Call Handling JMeter Limitations:
Protocol-Level Operation Only:
JMeter simulates requests at the HTTP protocol level, meaning it cannot execute or interpret client-side JavaScript that often triggers AJAX calls. This results in partial request capture, especially for modern web apps.
Misses Post-Load Activity:
Asynchronous operations triggered by user interactions—like button clicks, dropdowns, or dynamic page updates—are not detected unless the exact request sequence is manually scripted, which is complex and unreliable.
Poor SPA Support (React, Angular, Vue):
In Single Page Applications (SPAs), content is loaded dynamically without full page reloads. Since JMeter doesn’t simulate browser-level behavior, it cannot interact with or track DOM changes after initial load. Accurately testing these flows requires fragile workarounds.
Manual Effort for AJAX Simulation:
Engineers need to manually inspect browser dev tools to identify asynchronous endpoints, then replicate the behavior using timers, think time, or custom logic in JMeter. This increases test maintenance and introduces risks of missing critical user paths.
LoadView Advantages:
Real Browser Execution Captures AJAX Seamlessly:
LoadView uses real browsers (like Chrome or Edge), which inherently support and execute all JavaScript and AJAX calls. This means every client-side trigger, no matter how dynamic or delayed, is captured accurately during test execution.
True End-to-End Rendering Simulation:
Because LoadView sees the page as an actual user would, events such as lazy-loaded content, infinite scroll, and auto-refresh widgets are fully tested—without needing custom code or delay timers.
Zero Scripting for Async Logic:
Testers can record scripts by simply interacting with the application (clicks, hovers, scrolls), and LoadView automatically maps out all network activity triggered—including chained AJAX requests. This eliminates guesswork and reduces script creation time.
SPA Compatibility Out of the Box:
LoadView can test applications built with modern front-end frameworks like Angular, React, and Vue without any additional configuration. As navigation and data updates happen inside the browser view, LoadView captures everything, just like a real user experience.
Accurate Response Timings Including Async Delays:
Since AJAX-heavy apps often delay showing key content until async data is loaded, LoadView’s metrics reflect these delays accurately—ensuring performance SLAs are based on actual user-perceived load times, not raw server response.
- Historical Test Run Comparison in LoadView Compare Results Across Multiple Test Executions
While real-time and static reporting are valuable, LoadView also offers historical trend tracking out of the box. Each test run is archived automatically and can be compared with previous executions.
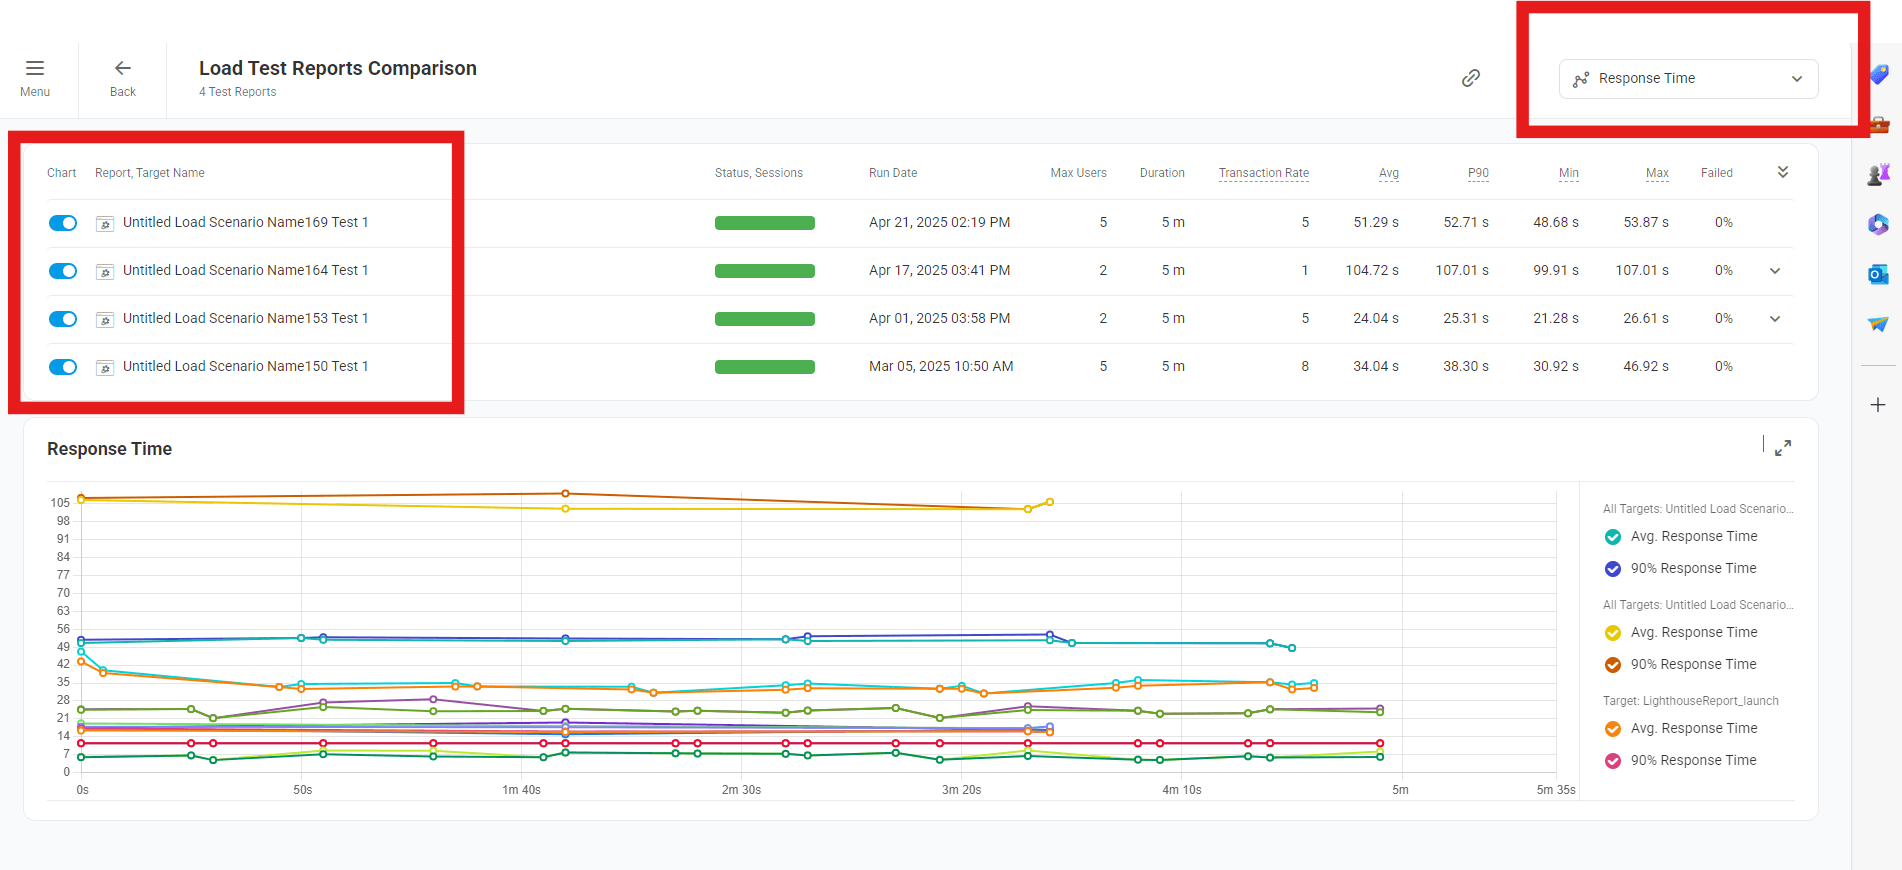
Before/After Performance View
This allows teams to evaluate changes made to application code, infrastructure, or third- party services by directly comparing previous performance baselines with the latest results—without complex integration or configuration.
No Setup Required
Unlike JMeter, which requires integration with InfluxDB and Grafana for historical visualization, LoadView makes trend comparison effortless with a simple web interface. No external tooling is required.
Example: A development team can compare a test from two weeks ago (before a database optimization) with the latest execution and immediately see improvements in response time and error rates.
JMeter Limitations:
No built-in live dashboard: JMeter does not provide real-time visibility into ongoing test execution. You must wait until the test finishes to view results.
Post-run analysis only: Any failures or issues are identified after the test completes, delaying root cause investigation and limiting in-test optimization.
External tools needed for live view: Real-time metrics require configuration of external databases (e.g., InfluxDB) and visualization platforms (e.g., Grafana), adding complexity and operational overhead.
Manual log correlation: Analyzing errors requires manually parsing .jtl files, mapping them to logs or application monitoring tools — a tedious and time-consuming process especially for multi-step flows.
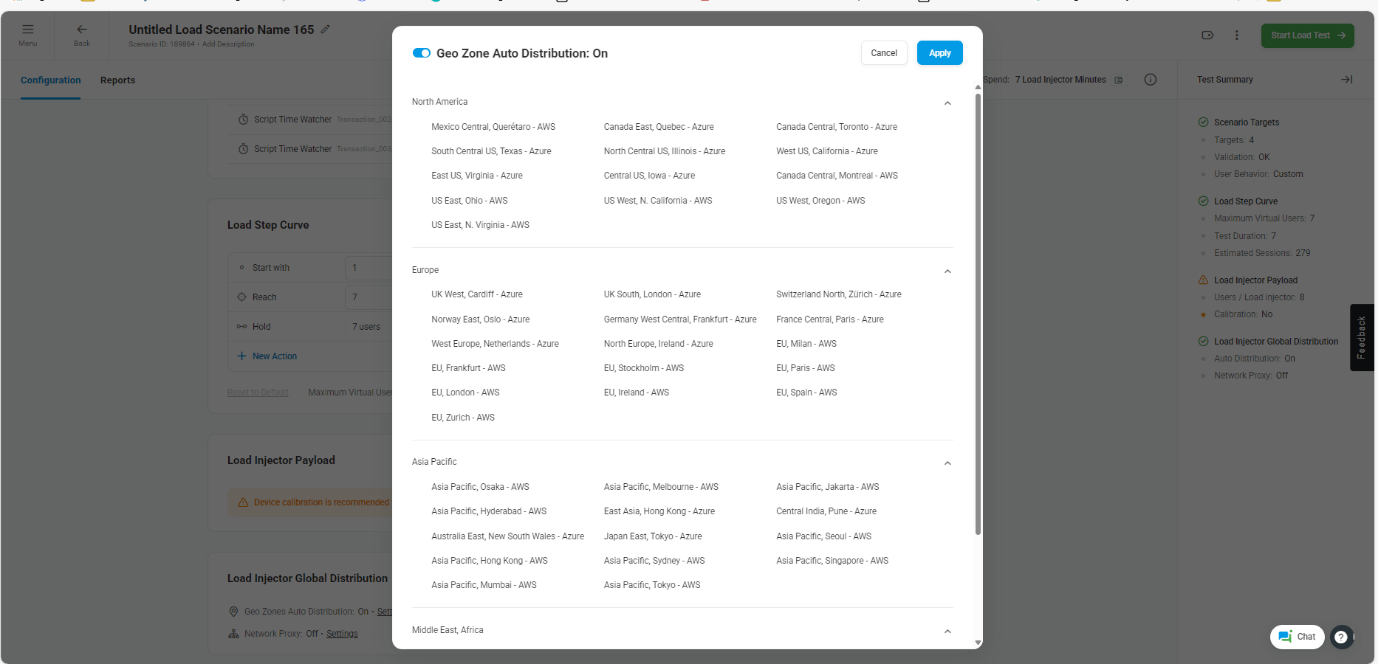
- IP-Level and Geo-Based Load Simulation LoadView Strengths:
True global distribution: LoadView allows you to simulate traffic from over 40 geographically diverse cloud-based locations worldwide. This helps ensure that applications deliver consistent performance across different regions. For Example If you need to know how your app performs from Singapore, London, and Sao Paulo, LoadView can do it with a click.
IP-geolocation mapped insights: Every virtual user session is associated with an IP address and geographic location. LoadView breaks down performance metrics like response time and error rate per location to help identify regional slowdowns or outages.

Zone-specific server diagnostics: LoadView tracks performance trends for individual geographic zones, making it easier to isolate infrastructure issues such as regional server overloads or CDN edge failures.
No remote server setup needed: Unlike traditional distributed testing approaches, LoadView requires no setup or maintenance of remote JMeter agents or cloud servers. All geo-distribution is handled seamlessly via LoadView’s cloud infrastructure.
JMeter Limitations:
Manual distributed testing setup: To simulate users from different locations, testers must manually configure remote JMeter agents and establish master-slave communication, which can be fragile and complex.
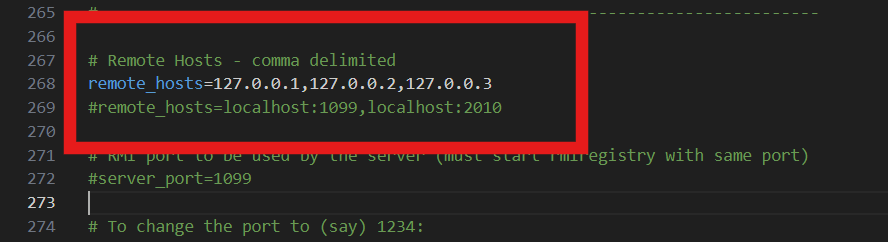

Network/firewall issues: Distributed execution in JMeter often runs into issues with corporate firewalls, NAT configurations, and open port requirements that slow down test setup and reliability.
No regional error visibility: JMeter does not natively provide performance data segmented by region. Testers must custom-implement IP tagging or post-process results to uncover geographic patterns.
- Real Browser Testing vs Protocol Simulation LoadView Strengths:
Tests real browser behavior: LoadView uses actual browsers like Chrome and Edge to replicate the real end-user experience. This includes JavaScript execution, CSS rendering, popups, redirects, and all dynamic front-end behaviors.
Captures real-world frontend metrics: Key performance metrics like Time to First Byte (TTFB), First Contentful Paint (FCP), Largest Contentful Paint (LCP), Cumulative Layout Shift (CLS), and Time to Interactive (TTI) are measured directly from the browser context. These are crucial for understanding true user-perceived performance.
Diagnoses frontend bottlenecks: LoadView captures screenshots, renders charts, and shows browser timelines so you can see precisely which visual or dynamic elements are slow to load, allowing frontend teams to optimize layout and interactivity.
JMeter Limitations:
Protocol-level simulation only: JMeter only operates at the network protocol level (HTTP/S), so it does not render the page or execute client-side code.
Misses client-side rendering errors: Any issues that happen after the initial page load, such as JavaScript runtime errors or slow UI components, are not captured.
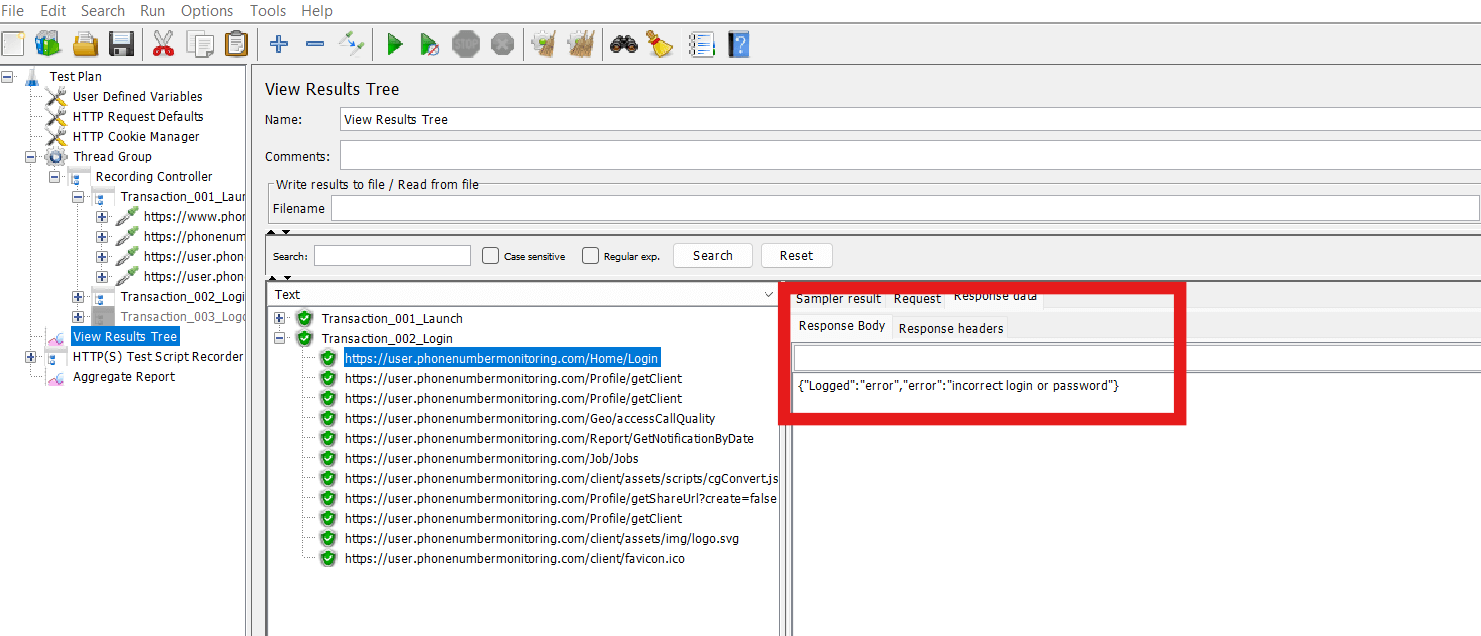
It only capture error message getting error in the response but still getting 200 as response code, so this is misleading.

Cannot measure real UX performance: Without a browser rendering engine, JMeter cannot evaluate user-centric metrics like paint times or layout shifts, limiting its use for frontend performance validation.
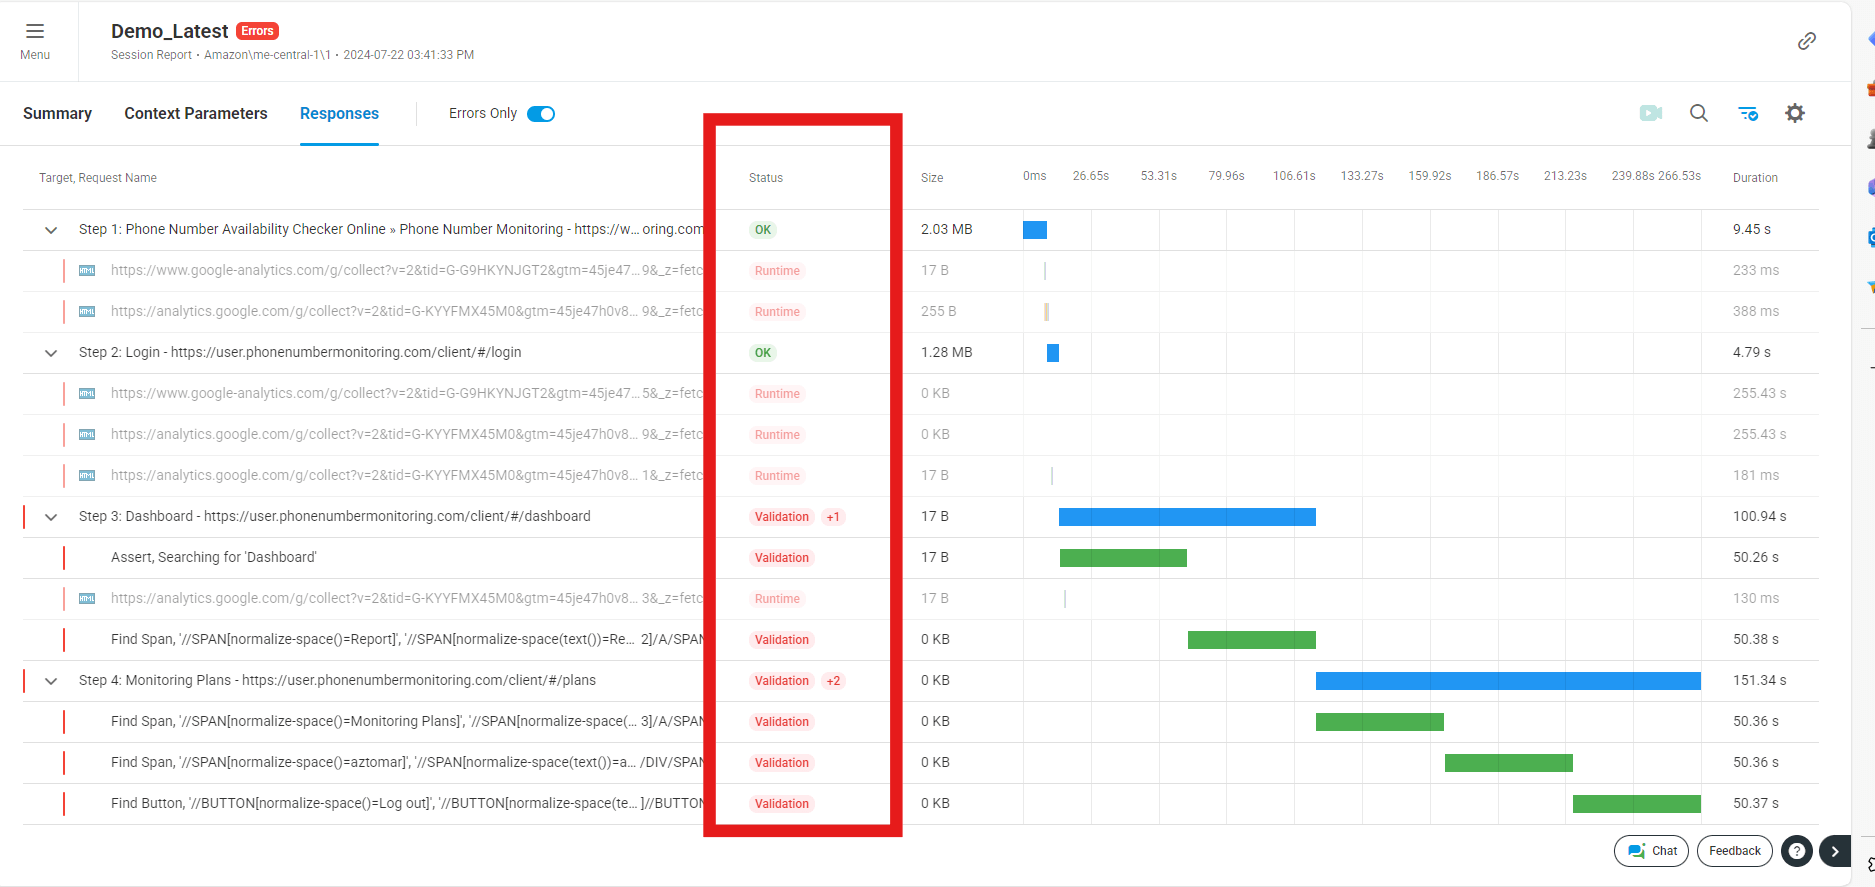
- Error Categorization and Debugging LoadView Strengths:
Automatic error classification: LoadView intelligently groups errors into predefined categories — such as Validation Errors (e.g., missing text, element not found), Client-Side Errors (timeouts, script crashes), Server Errors (HTTP 500, 503), and Third-Party Failures (external service or API unavailability). This helps teams immediately understand the nature and source of the failure.
Screenshots and session videos: For each significant failure, LoadView captures a screenshot or browser video recording of the virtual user’s experience at the point of error. This makes it easy to visually inspect what went wrong without needing to reproduce the issue manually.
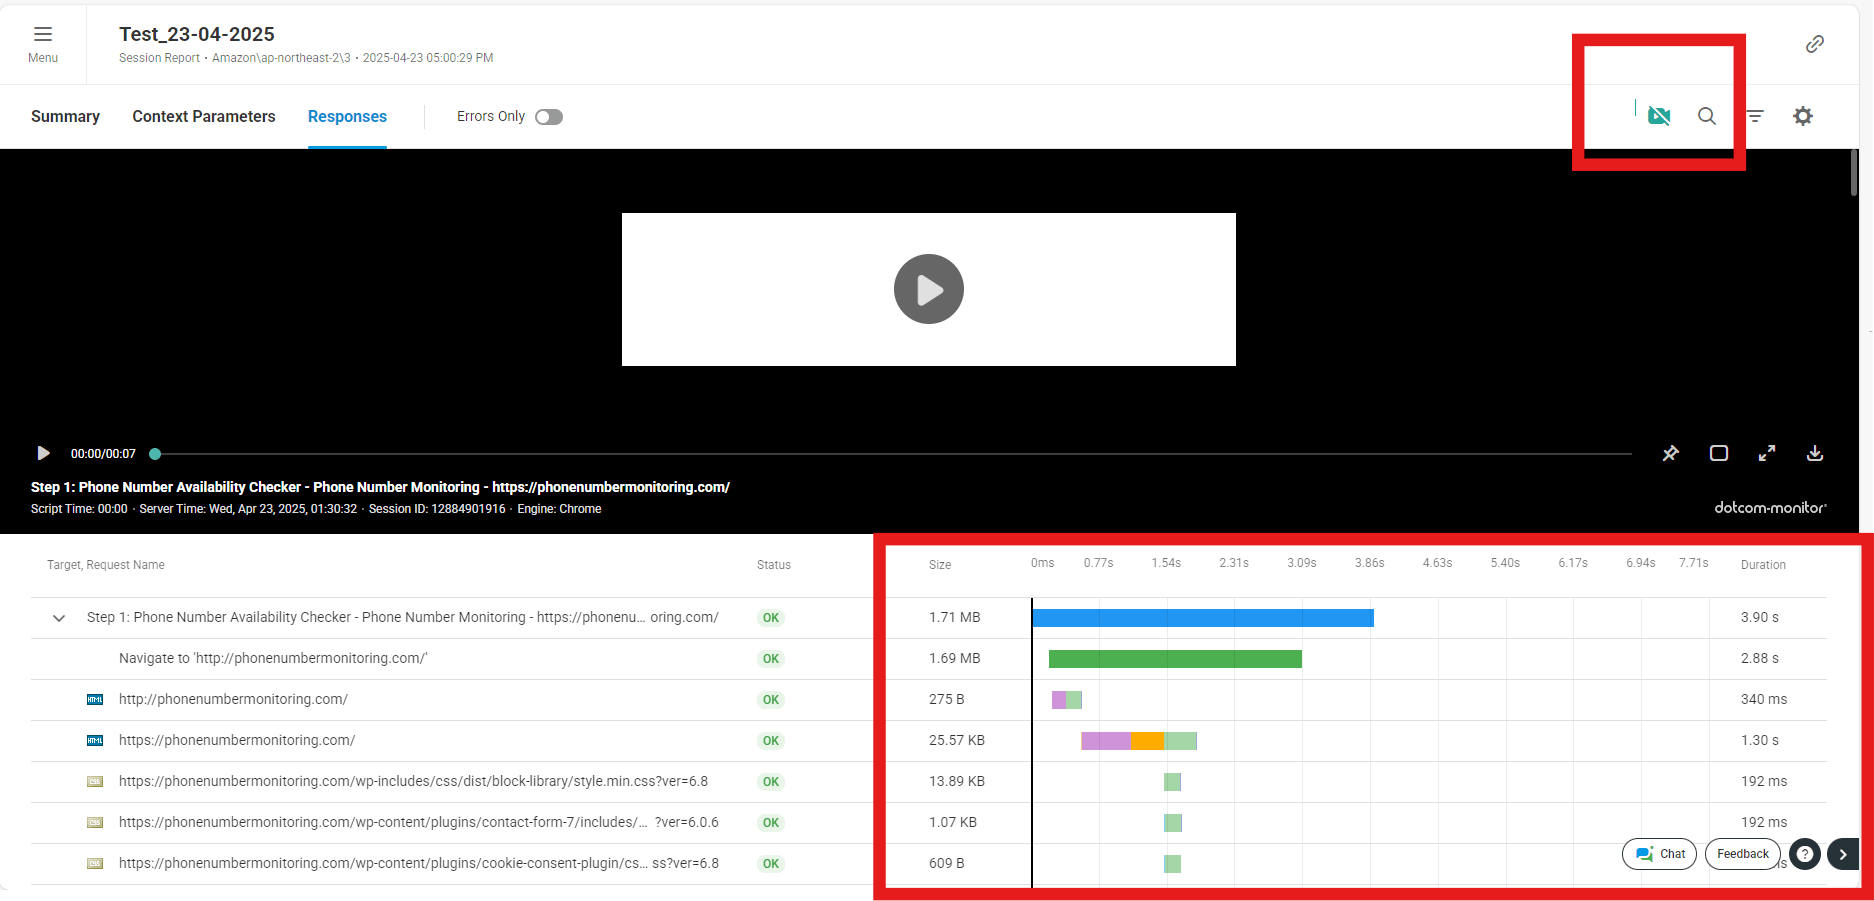
LoadView includes a built-in session replay feature where you can watch how the test actually ran in the browser. As shown in the screenshot, it displays a real-time rendering of the application under test, including user interaction with elements like buttons, menus, or login prompts. This helps teams visually confirm whether a page loaded correctly, which elements were delayed, and what the user saw when an error occurred.
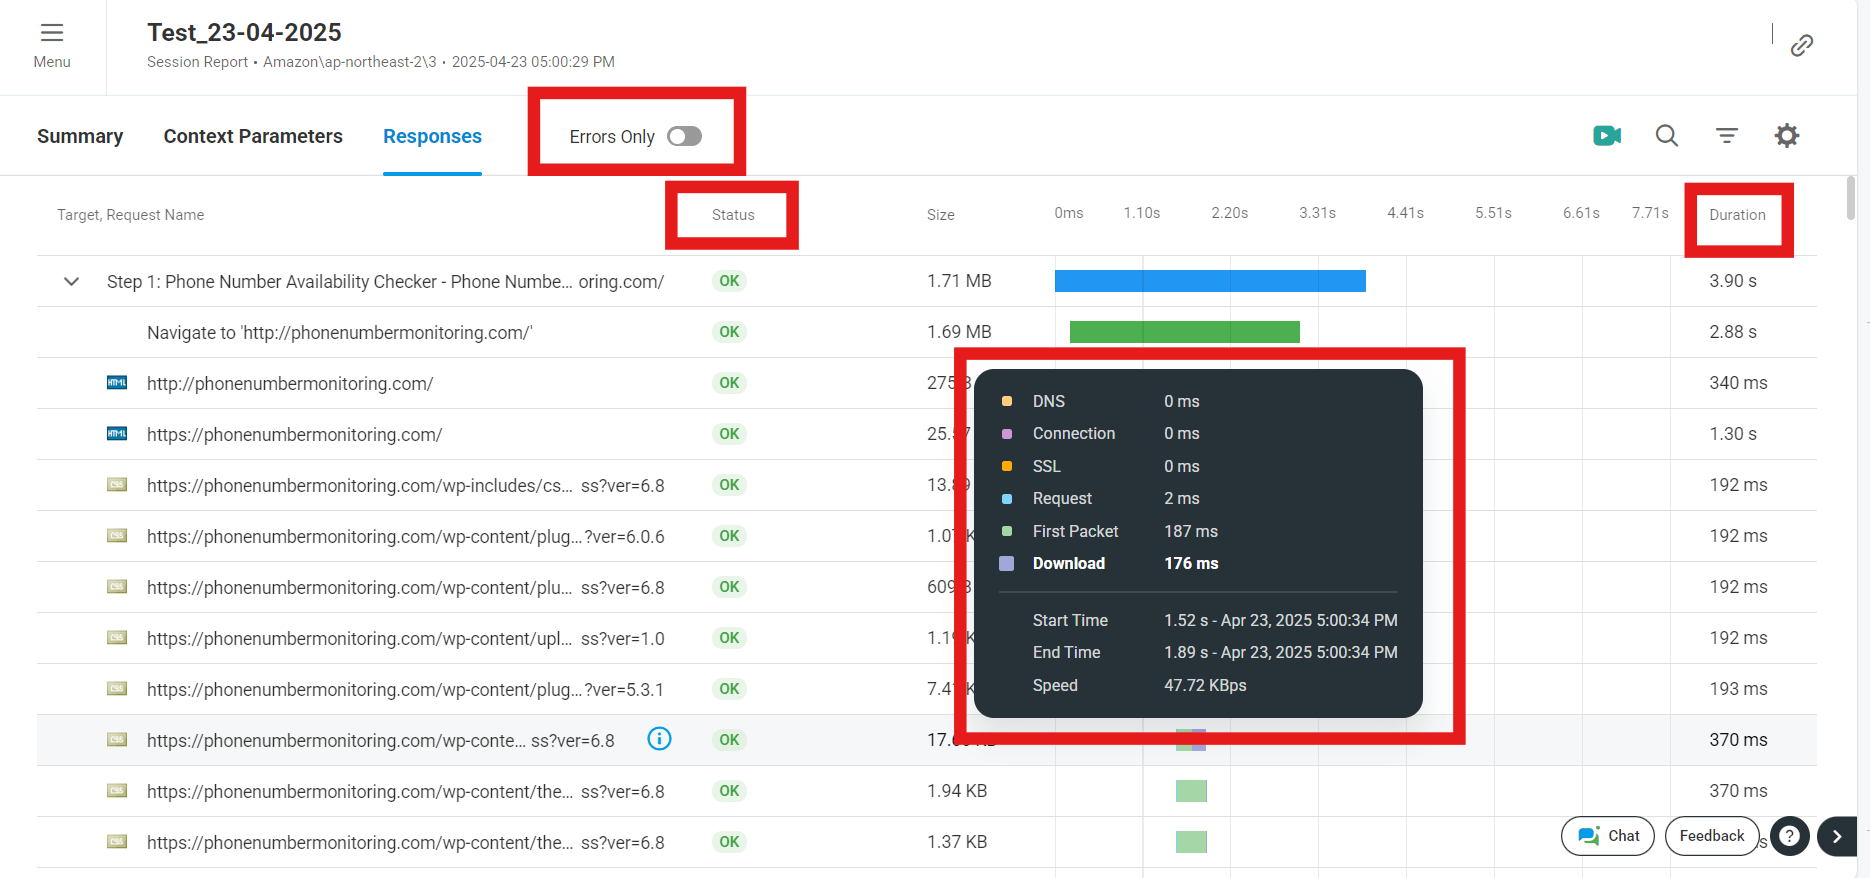
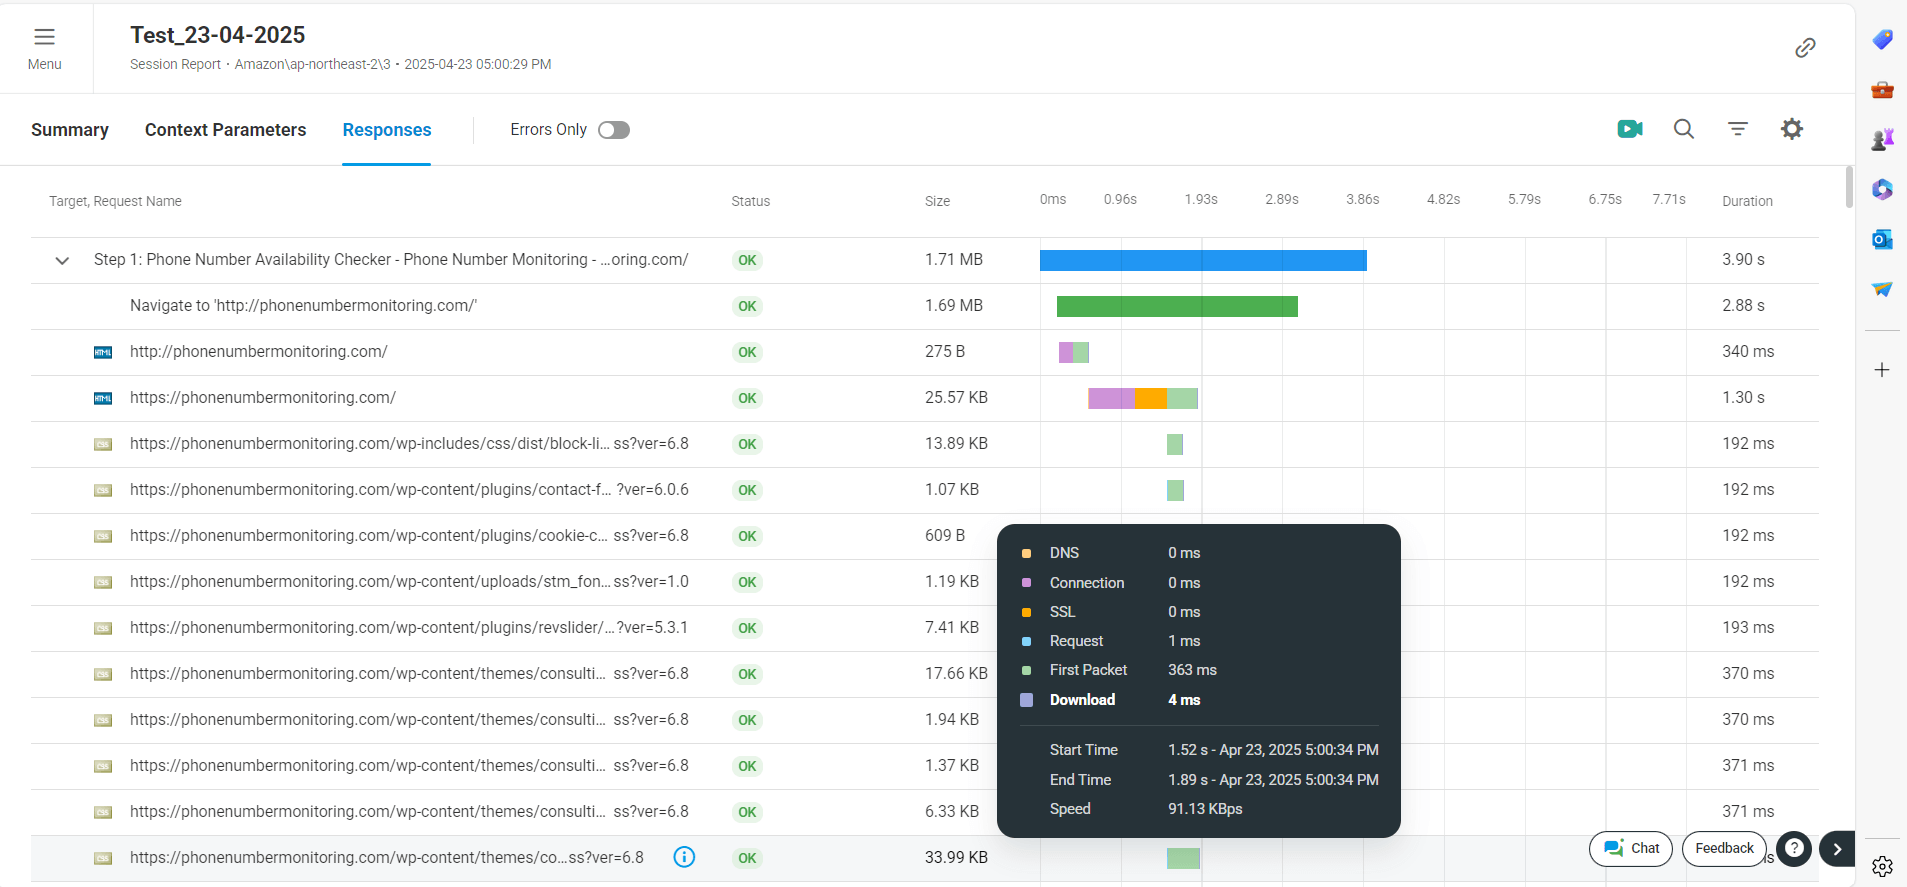
Waterfall Timing + Video Frame Alignment
Below the playback frame, LoadView presents a waterfall chart showing the sequence and duration of network calls made by the browser. Each asset (HTML, JS, CSS, images, APIs) is tracked with start and end timing. This combination of visual output and backend metrics makes LoadView a complete tool for frontend performance analysis.
Example Use Case: You can pinpoint whether a delay was due to a slow-loading stylesheet or a missing API response while watching the browser wait visually — something traditional tools like JMeter cannot offer
Session ID linking for easy reproduction: Every error is tied to a unique session ID and test step, allowing testers to quickly replay the session or trace the sequence of events that led to the failure, dramatically improving debug turnaround time.
JMeter Limitations:
Raw error logs without visual context: JMeter provides error information as raw HTTP status codes or exception traces within .jtl files, which do not indicate what was happening on the UI at the time of the error.
Manual cross-referencing required: Debugging a JMeter error typically involves correlating timestamps and request IDs across multiple log files, application logs, and browser sessions — a time-consuming and error-prone process.
No session playback or visual feedback: JMeter operates at the protocol level and does not include browser-based playback or video capture capabilities. Testers cannot visually confirm what was rendered or what the end-user saw during a test.
No waterfall chart or browser-rendered asset timing: JMeter lacks built-in waterfall visualizations showing frontend resource loading times. This makes identifying slow CSS, JavaScript, or image load times more complex and manual.
No browser context for debugging: Without browser execution, there is no DOM inspection or visibility into layout shifts, rendering errors, or visual glitches — limiting the tool’s usefulness for frontend performance and UX testing.
Best Use Cases for JMeter (Protocol-Level Testing)
JMeter is an open-source tool that simulates HTTP-level load (without rendering a browser), making it a powerful option for backend and low-cost, high-scale testing. Ideal when browser interaction is not required.
| Use Case
1. API Load Testing |
Why JMeter Works Well | Example |
| Supports REST, SOAP, and GraphQL APIs out of the box. Easy to add headers, params, and validate JSON/XML. | Load testing a payment gateway API or internal microservices | |
| 2. Database Load Testing | JDBC sampler supports direct interaction with DBs; useful for stress testing queries. | Load test a reporting engine querying MySQL or PostgreSQL |
| 3. CI/CD Integration | Easily plugged into Jenkins, GitHub Actions, GitLab, etc. via command-line or plugins. | Run JMeter test after every deployment automatically |
| 4. Messaging System Testing | Supports JMS, MQTT, and custom plugins for Kafka and RabbitMQ. | Load testing an event- based system using JMS messages |
| 5. File Upload / Download Testing | Test file-based services over HTTP/SFTP/FTP. | Simulate multiple users uploading documents |
| 6. High Volume, Low Cost Load Testing | Lightweight execution; capable of simulating 10k+ virtual users from a single machine (if no rendering needed). | Performance testing an internal CMS |
| 7. Custom Logic with Groovy/JS/Beanshell | Easily script custom flows, dynamic data, or session behavior. | Simulating loan approval logic with multiple branches |
Who Should Use JMeter?
DevOps engineers, backend developers, and testers focusing on APIs, database performance, or integration scenarios without the need for browser rendering.
Best Use Cases for LoadView (Real Browser-Based Testing)
LoadView uses real browsers (Chrome, Edge) to simulate actual user behavior, making it ideal for modern web applications and teams that prioritize user experience and visual validation.
| Use Case | Why LoadView is the Best Fit | Example |
| 1. Browser-Based Load Testing | Executes real user journeys with JavaScript, cookies, DOM updates, and page rendering. | Load testing a travel booking portal |
| 2. SPA Testing (React, Angular, Vue) | Automatically handles async behavior (AJAX, fetch, websockets) from JS frameworks. | Testing a customer dashboard in Angular |
| 3. E-Commerce UX Validation | Measures load time, FCP, LCP, TTI — actual metrics impacting conversion rate. | Load test a cart-to-checkout flow before Black Friday |
| 4. Geo-Distributed Testing | Supports testing from 40+ locations to mimic user access from different regions. | Test site speed from US, Europe, and India |
| 5. No Scripting Load Testing | Record flows like a user (clicks, scrolls, filters, navigation). No technical scripting needed. | Product managers or QA teams test user flows without dev input |
| 6. Stakeholder- Ready Reports | Reports include session replays, visual charts, PDF exports — suitable for business/non-technical users. | Share results with VPs, product owners, or clients |
| 7. Dynamic Content Validation | Captures every UI change, delayed rendering, modal windows, or AJAX-based filters. | Testing a hotel listing site with filters and lazy-loading |
Who Should Use LoadView?
QA teams, product managers, frontend developers, UX designers, and business analysts validating modern web performance, especially in SPAs or real-user flow validation.
- LoadView vs JMeter: Reporting Feature Comparison
| Feature Report Access & Timing | 🔵 LoadView | 🟠 JMeter |
| Real-time, cloud-hosted reports accessible even during test execution. | Post-test only; no built-in real-time visibility. | |
| Data Granularity | High detail with drill- down to individual sessions and network requests. | High-level metrics (average response, throughput); limited session detail. |
| Visualization | Rich, interactive charts (response times, error types, user activity). | Basic charts via Listeners (e.g., Summary Report); limited native visualization. |
| Live Dashboard | Built-in dashboard with continuous live updates during test runs. | Not included; requires external integration (e.g., Grafana). |
| Historical Comparison | Automatic trend tracking and visual comparison across multiple test runs. | Requires manual setup using external tools like InfluxDB + Grafana. |
| Report Sharing | Easy sharing via cloud- hosted PDFs and public/private dashboard links. | Generates local HTML/CSV files; sharing must be done manually. |
| Error Analysis | Auto-classification of errors: client, server, validation, 3rd-party, etc. | Raw error logs (HTTP codes); manual classification and analysis required. |
| Debugging Context | Screenshots, session videos, session replays, and waterfall charts. | No visual support; relies on log correlation and manual investigation. |
| Session Tracking | Full session-wise breakdown with step-by- step navigation. | No native session tracking; requires parsing raw logs. |
| Geographical Insights | Region-wise performance breakdown; useful for global load tests. | No built-in support; must implement custom scripts or tools. |
| Frontend Metrics (UX) | Captures real browser metrics: FCP, LCP, TTI, and Time to Interactive. | Cannot capture UX/browser metrics due to protocol-level operation. |
| Report Formats | PDF, Excel, and interactive cloud links | HTML and CSV; limited customization. |
| Setup Complexity | Minimal setup; all reporting features available out of the box in cloud. | Requires configuring listeners and external tools for advanced reporting. |
Summary from the Article
LoadView offers an advanced reporting experience tailored for modern, dynamic web applications. It enables:
Real-time access to live data and charts during test execution.
Deep insights into individual user journeys with visual evidence like session replays. Effortless report sharing and collaboration.
Easy debugging with built-in browser metrics, geographical insights, and detailed error classification.
JMeter, while powerful for protocol-level API and backend performance testing, provides:
Basic post-execution reports with limited visualization.
No native support for browser-based metrics or real-time dashboards.
Advanced reporting features only achievable through complex setups involving InfluxDB, Grafana, or custom scripting.