Load Testing Technologies
The following protocols are natively supported by the LoadView testing platform.
Choose one of the technologies listed below to learn more.
AJAX Load Testing
More than 20 years ago, there was no way to update a web page without displaying a boring white screen while reloading of the whole page. Thankfully, AJAX has closed this gap and introduced asynchronous data load concept, which enables user to interact with the page while data loads in the background. Nowadays, this concept is the foundation of our content rich and interactive web applications.
AJAX is an abbreviation for Asynchronous JavaScript and XML and it’s more than a technology because it consists of HTML, CSS, JavaScript, XMLHttpRequest and a server-side scripting language such as PHP. An AJAX request consists of the following 6 steps:
- A web page fires a content change event
- The handler of this web page creates an XMLHttpRequest object
- The XMLHttpRequest object requests a document from the server
- The Server retrieves appropriate data and sends it back
- The XMLHttpRequest fires an event to notify the web page the data has arrived
- The handler processes the data and displays it
The flipside from a performance engineer’s perspective is that automation of such asynchronous communication is tricky. Consider load testing a web application which has to serve 100 concurrent users and 10000 searches per hour. You are tasked to validate if the average response time of this application is within the boundaries of 3 seconds.
Basically, you have the following two options for a load test scenario:
- Protocol-based simulation
- Browser-based simulation
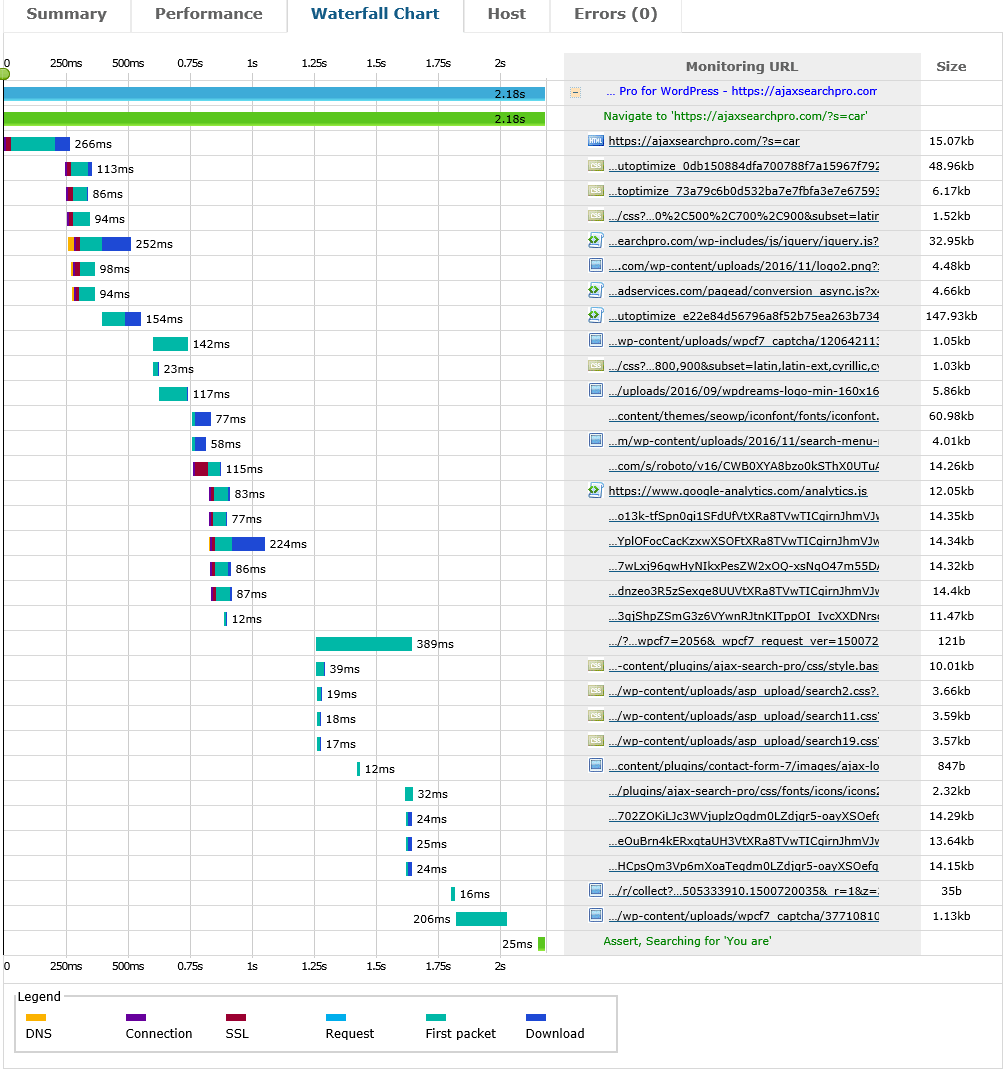
Let’s compare protocol level with browser level load simulation. The table below reflects the results of this experiment:
Description
Screenshot
Protocol Level Simulation
1 Client-Server Request
0.52 sec load time
Browser Level Simulation
32 Client-Server Requests
2.18 sec load time
AngularJS Load Testing
Front-end developers love AngularJS because it helps to simplify complex code. This simple and powerful framework solves the error prone DOM manipulation issues with its declarative description of the UI flow. AngularJS is an open source JavaScript Framework and can be added to a page with a simple script tag such as:
<script src=”https://ajax.googleapis.com/ajax/libs/angularjs/1.6.4/angular.min.js”>
</script>
It supports separation of concern and brings dynamic elements to static HTML. Like any other application, also AngularJS-based systems can quickly be impacted by performance issues. Here are a few steps you can take to speed things up on your next NG load testing project:
- Reduce the number of DOM operations to the minimum
- Reduce the total elements of your DOM tree
- Use Chrome profiler to check the memory footprint
- Reduce the activities in your watcher
LoadView gives you everything you need when it comes to accurate AngularJS load testing.
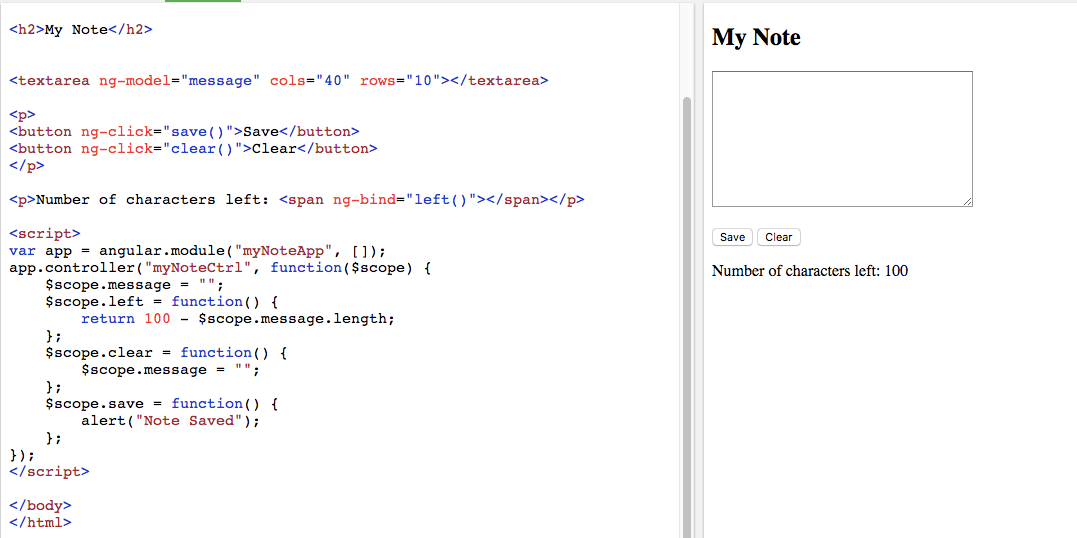
The example below uses a message input based on AngularJS. The screenshot below contains its source code on the left side and the app on the right side.
Description
Screenshot
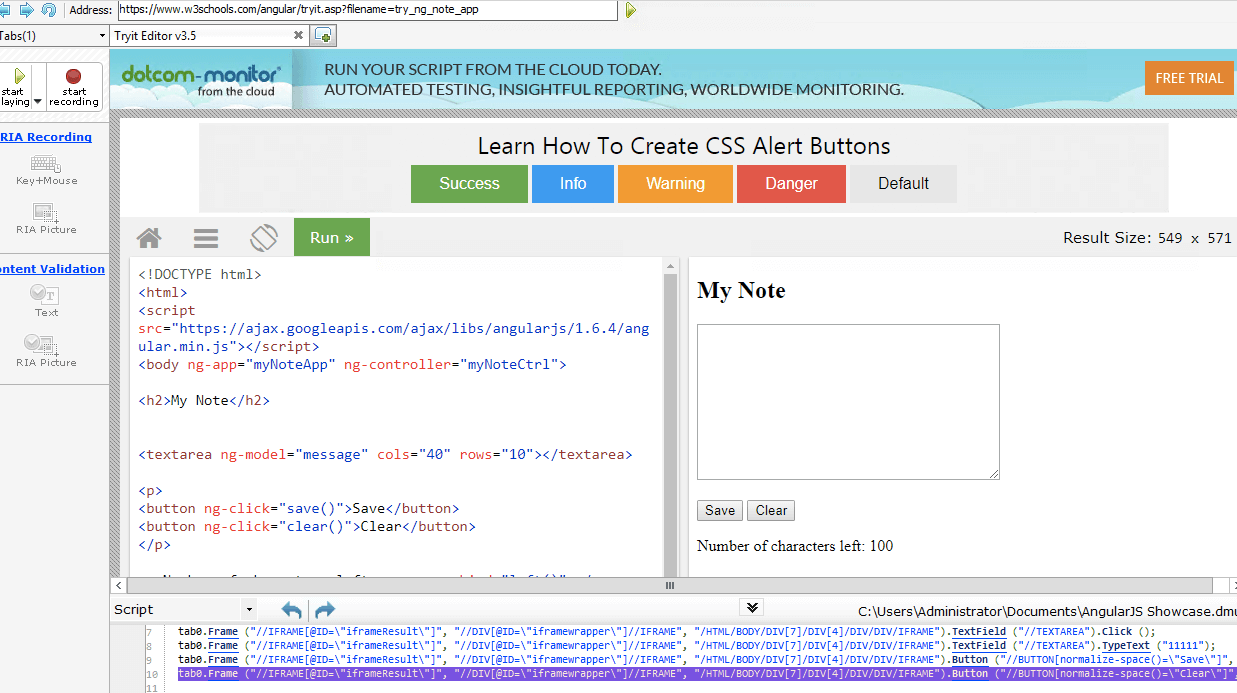
Record Test Script for AngularJS Application
Record the AngularJS script with the EveryStep Web Recorder
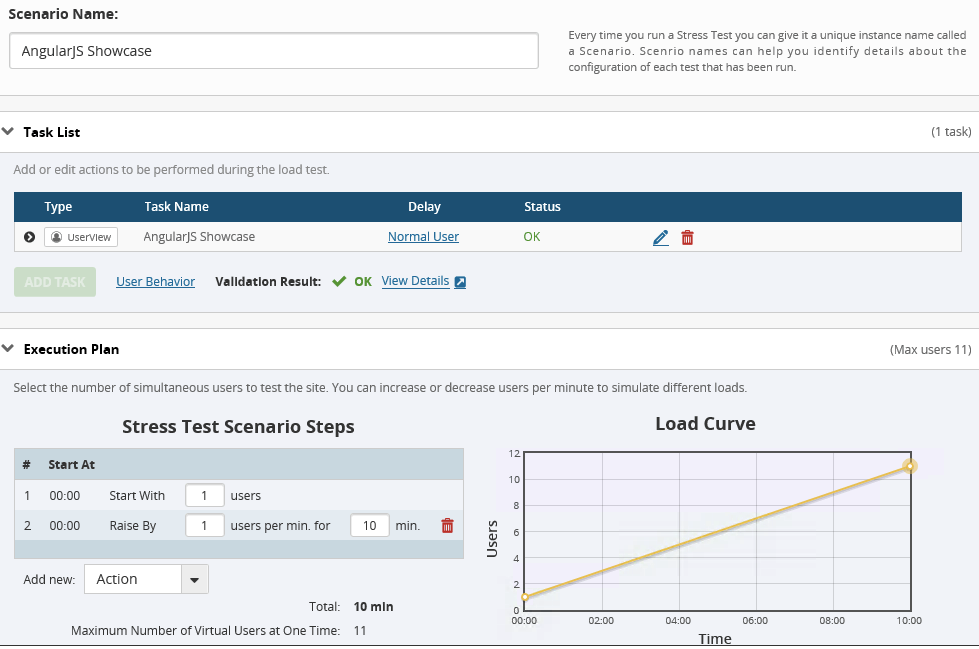
Design Load Test for AngularJS Application
Configure the Test Execution Plan
Flash Load Testing
Flash is an authoring software and is used to create vector graphic-based animations. It’s a platform independent technology and runs on any machine where a Flash player is installed. Due to security concerns, companies often ban Flash from their infrastructure. However, you can build nice applications with Flash, as the overhead is low. However, the one small disadvantage of Flash is that it won’t run without an enabled Flash player plugin.
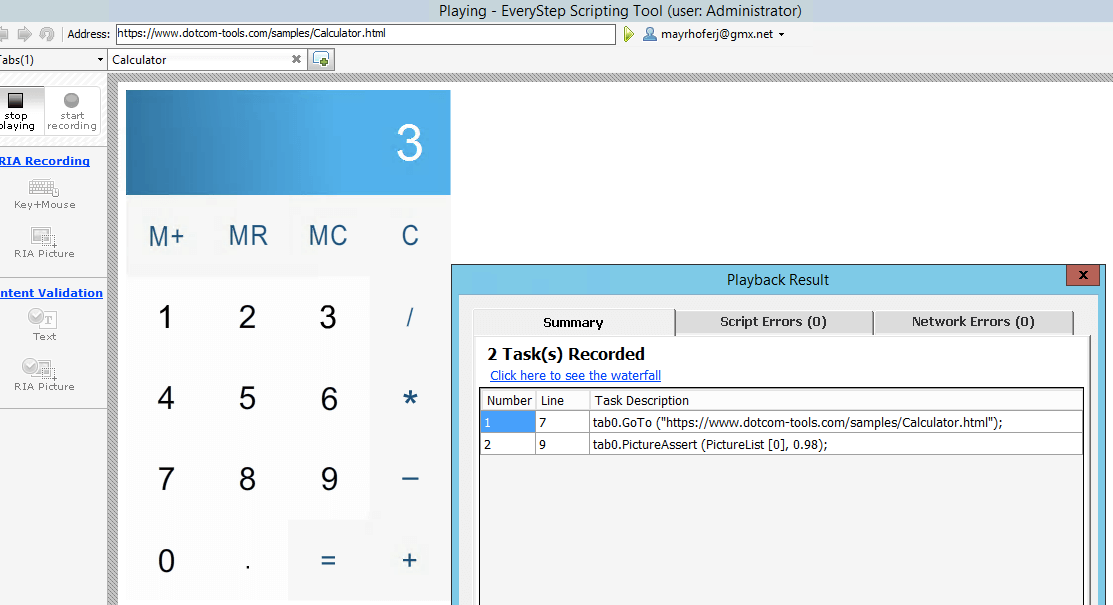
LoadView gives you everything you need when it comes to accurate FLASH load testing. I’ve used a simple Flash-based Calculator: https://www.dotcom-tools.com/samples/Calculator.html. My load test scenario executes a simple 1 + 2 = 3 calculation.
Description
Screenshot
Record a Test Script for a Flash Application
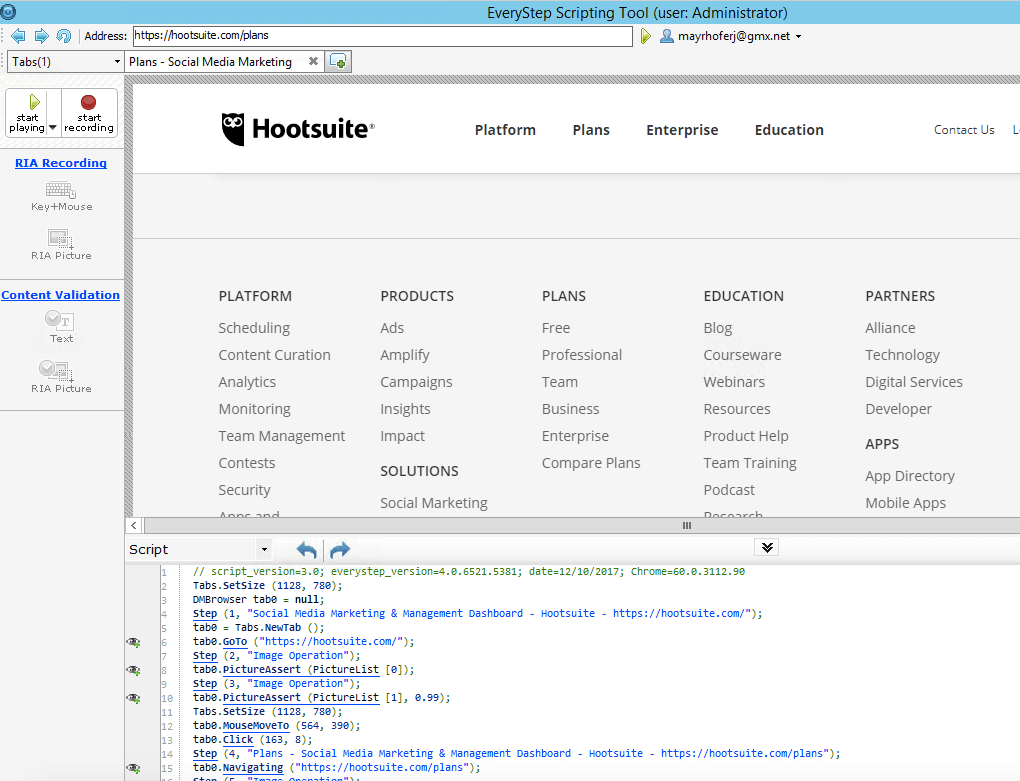
Record the script with the EveryStep Web Recorder
Add verification
Run & Upload the script
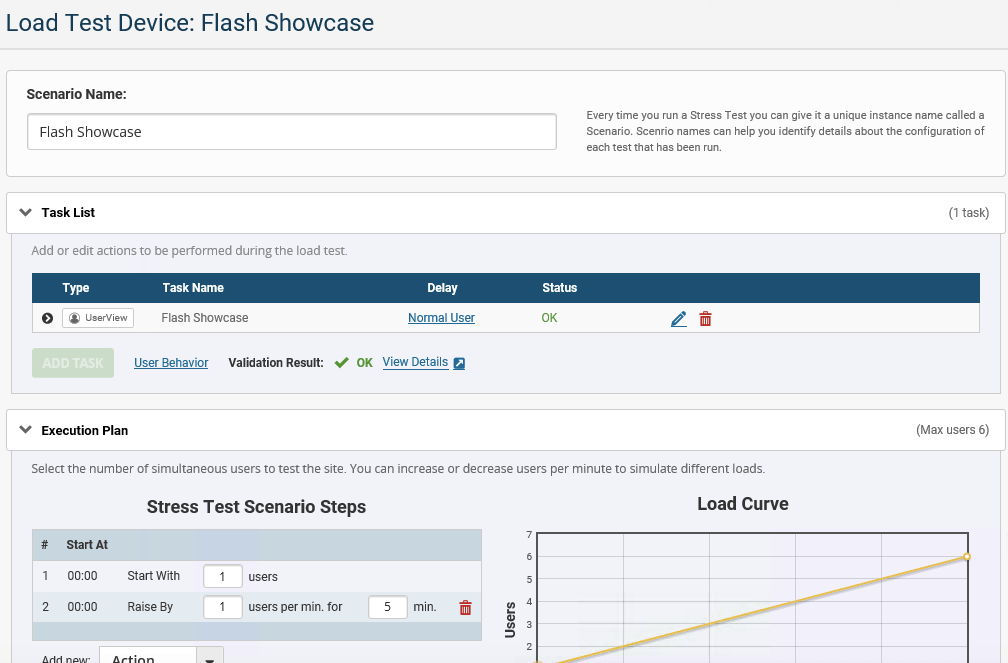
Design a Load Test for a Flash Application
Configure the Test Execution Plan
Distribute your virtual user on load injectors located around the world
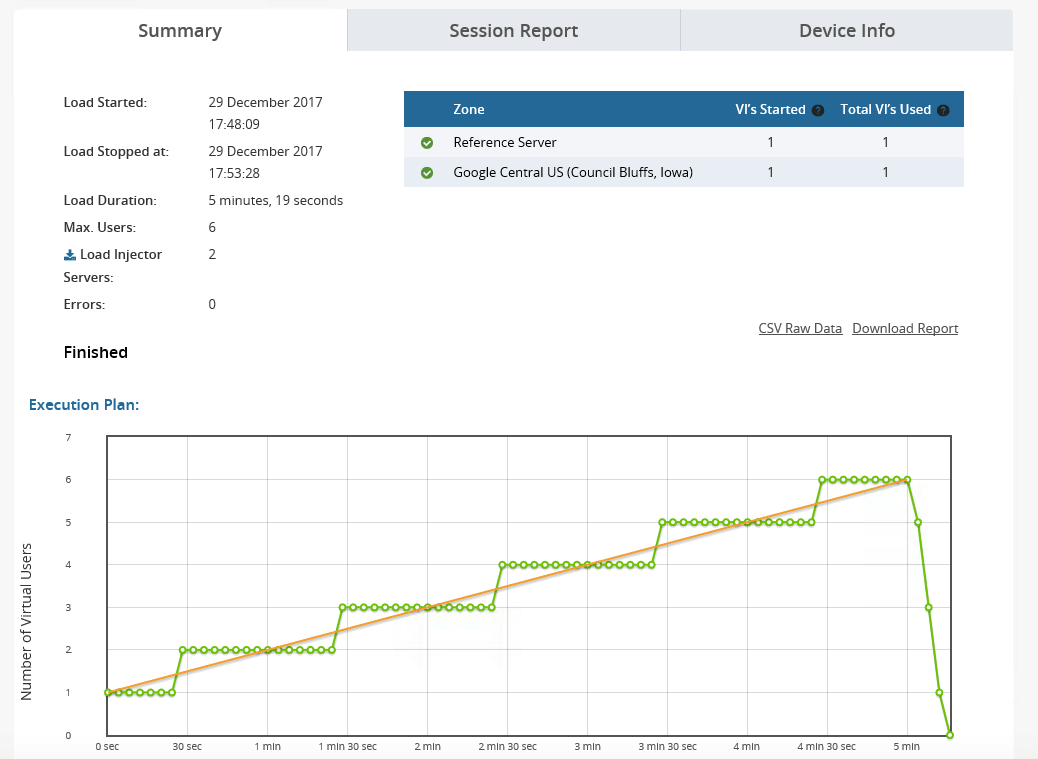
Run the Load Test for the Flash Application
Watch how LoadView ramps up the load and take note of the response times of your Flash application during the load test.
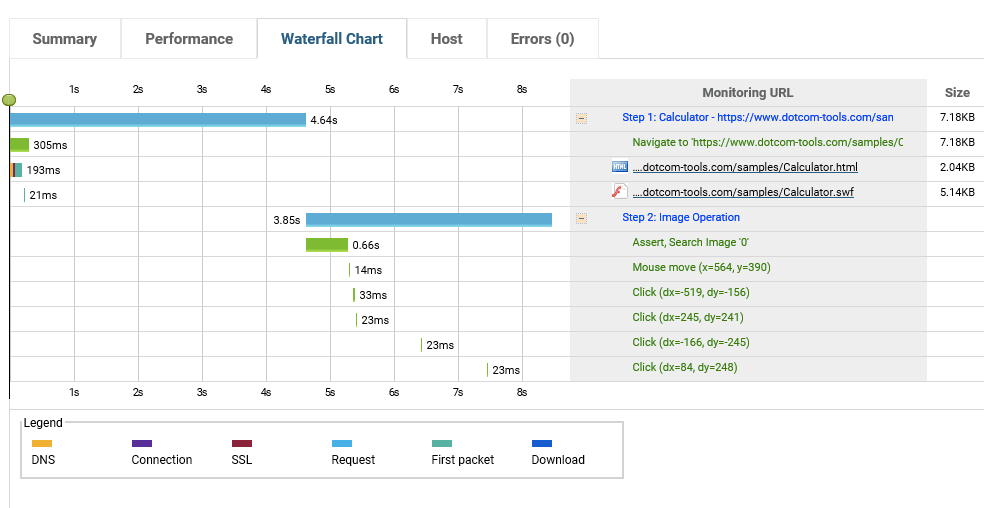
Results Analysis for the Flash Application
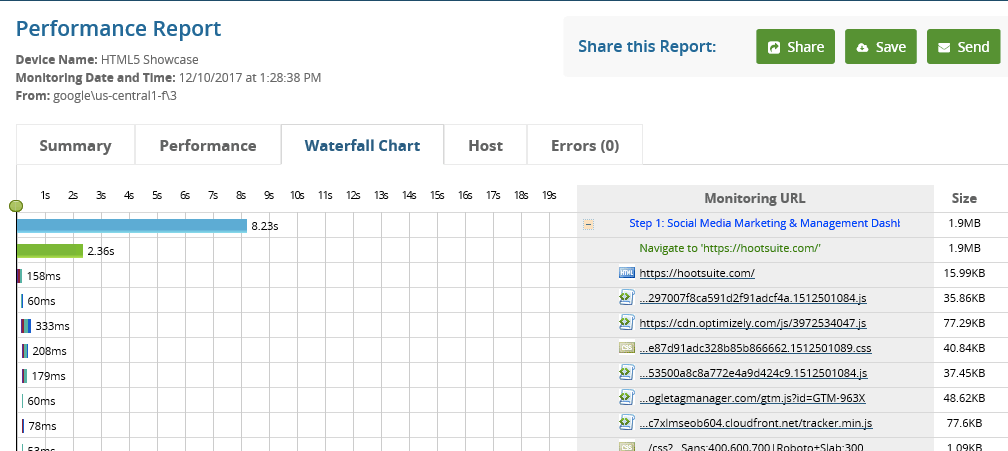
Once the test run has finished, LoadView will provide a detailed report, videos, and valuable insight, such as waterfall charts or videos.
Share those your Dev team to identify the root-cause of hotspots.
Known Issue
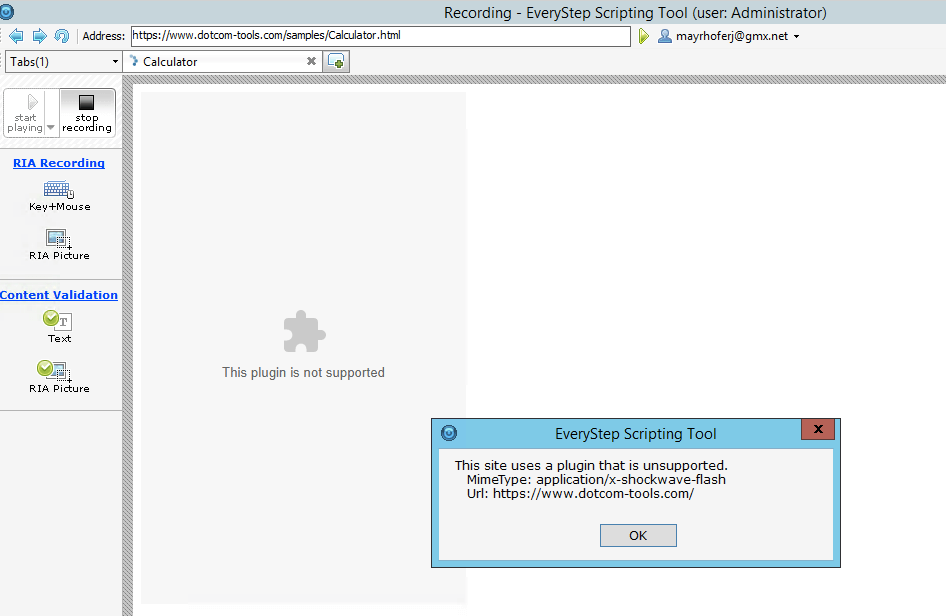
Scripting of a Flash-based application works only with Internet Explorer. You will receive the following error if you use Chrome or any other browser for your recording.
HTML5 is the fifth version of the HTML, standard, which is still the backbone of our web applications. The ingredients of HTLM5 are:
- HTML which provides the structure
- CSS which takes care for the presentation
- JavaScript which makes things happen
HTML5 gives you everything required to implement beautiful applications running in your browser without the need of any plugins. Such applications are known as cross-platform based applications. They run on any device if your browser supports HTML5. The following is an example of load testing HTML5 with LoadView.
Description
Screenshot
Record a Test Script for an HTML5 Application
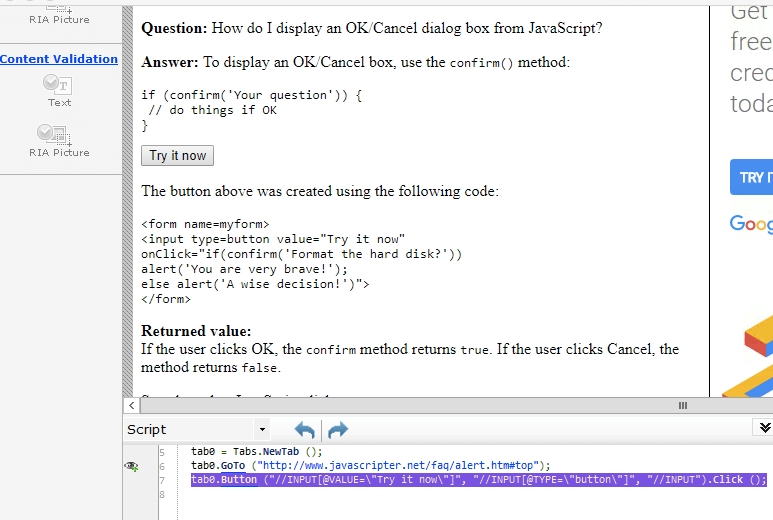
Record the script with the EveryStep Web Recorder
Add verification
Run & upload the script
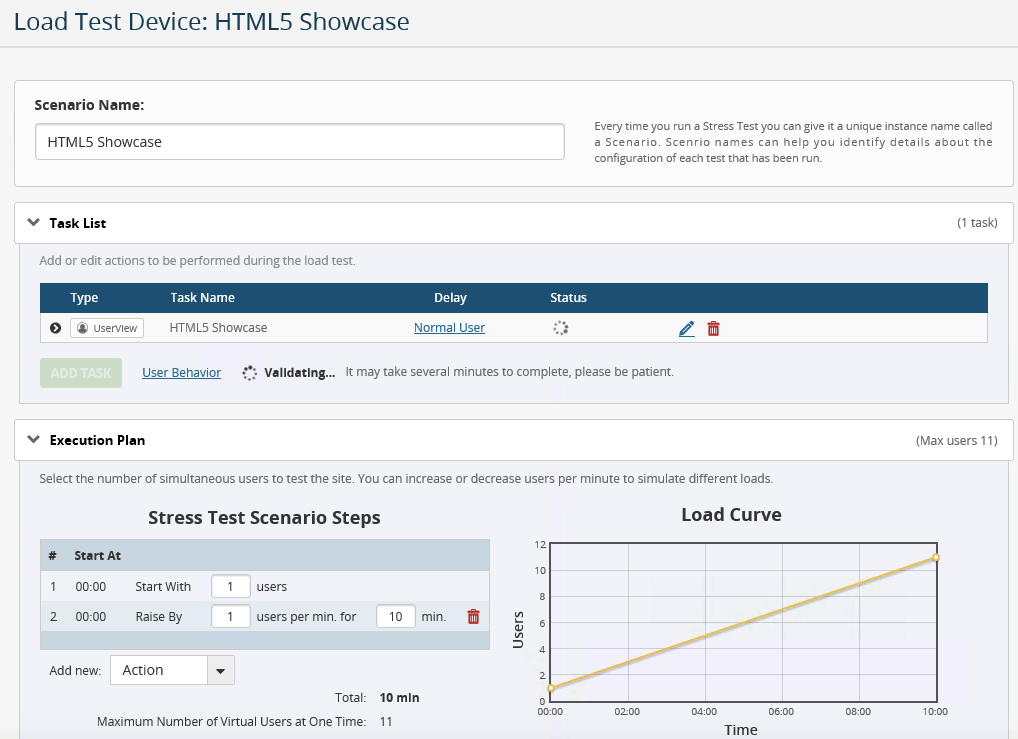
Design a Load Test for an HTML5 Application
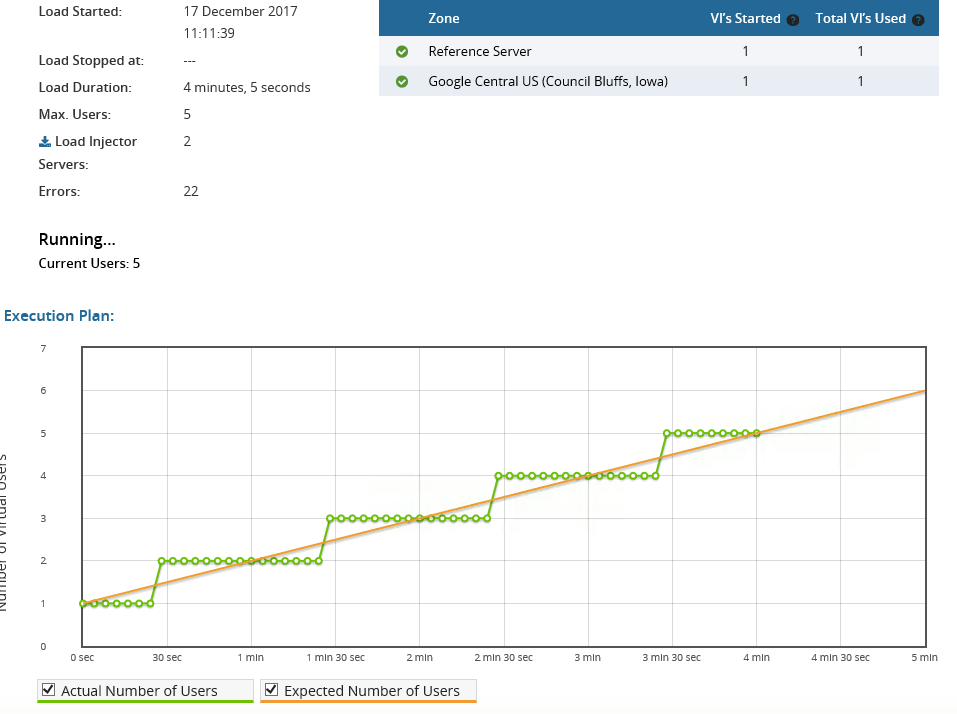
Configure the Test execution plan
Distribute your virtual user on load injectors located around the world
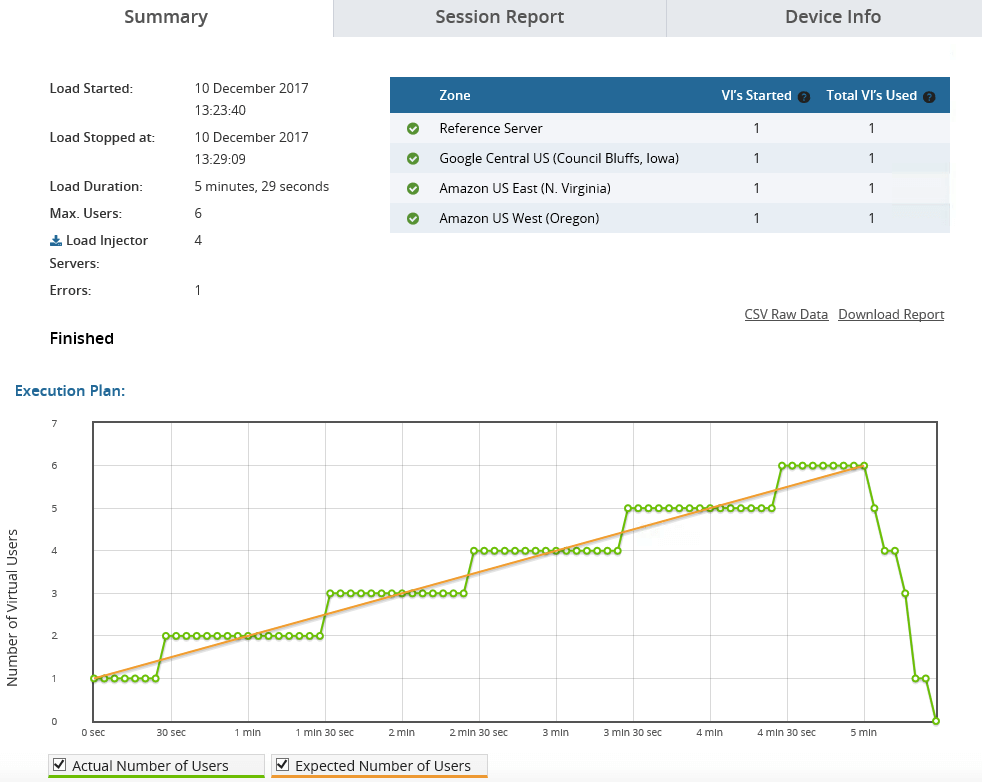
Run a Load Test for an HTML5 Application
As LoadView ramps up the load, view response times of your HTML5 application and behavior during load test execution.
Results Analysis for an HTML5 Application
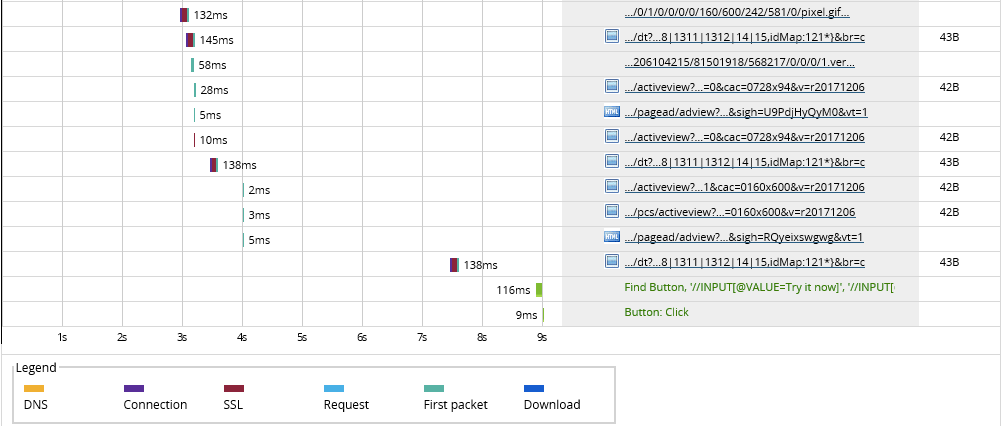
Once the test run has finished, LoadView will provide a detailed report, videos, and valuable insight, such as waterfall charts or videos.
Share those results with your Dev team to identify the root-cause of hotspots.
JavaScript is the major programming language of the web. It is used to bring interactive features to the web and builds the foundation for many frameworks, such as AngularJS or AJAX. Hackers have recently used JavaScript to execute critical commands on victims’ machine. You can disable JavaScript execution in your browser, but this will block many websites on your computer.
There are some known performance limitations when it comes to JavaScript. It’s a good idea to investigate those in your next JavaScript-based load test. Here are some things that you can do to make the scripting process easier:
- Reduce activity in loops
- Don’t make calculations inside your loops because this gets executed many times and impacts response times.
- Reduce DOM access
- DOM access is slow. Create a local variable, assign the required value and use this for your operations.
- Reduce DOM size
- Keeping DOM size small will speed up page load times and DOM access via JavaScript.
- Delay JavaScript loading
- Load the script at the end of your page because it will block page rendering until the download has finished. Alternatively, you can also use the “defer=true” tag loads the script after your page has rendered.
LoadView gives you everything you need when it comes to accurate JavaScript load testing. The example below illustrates how easy JavaScript load testing actually is with LoadView.
Description
Screenshot
Record Test Script for Your Application
Record the script with the EveryStep Web Recorder
Run & Upload the script
Design Load Test for Your Application
Configure the Test Execution Plan
Distribute your virtual user on load injectors located around the world.
Run the Load Test for Your Application
As LoadView ramps up the load, view response times of your JavaScript application and behavior during load test execution.
Results Analysis for Your Application
Once the test run has finished LoadView will provide a detailed report, videos, and valuable insight, such as waterfall charts or videos
Share those results with your Dev team to identify the root-cause of hotspots.
JSON is an abbreviation for JavaScript Object Notation and is quite similar to XML. It’s a very common data format and used for all kind of browser-server communication. Simplicity, broad programming language support and low overhead are the reason for its popularity.
Some JSON specific performance hotspots include the following:
- Download of large files takes too long
- Memory utilization is too high
In comparison with SOAP XML, the footprint of JSON is lower and it’s easier to read. The example below illustrates JSON load testing with LoadView.
We use JSON in the search functionality on our website. This is the corresponding JSON source code:
This is the search functionality we will use in the JSON load testing showcase:
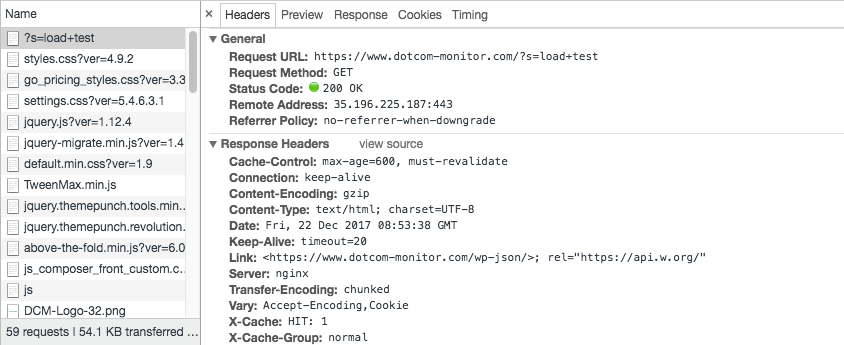
We’ve used Chrome developer tools to identify the request URL used in this search form.
Description
Screenshot
Record Test Script for JSON Application
Load testing begins with recording a script, using the EveryStep Web Recorder.
Design Load Test for JSON Application
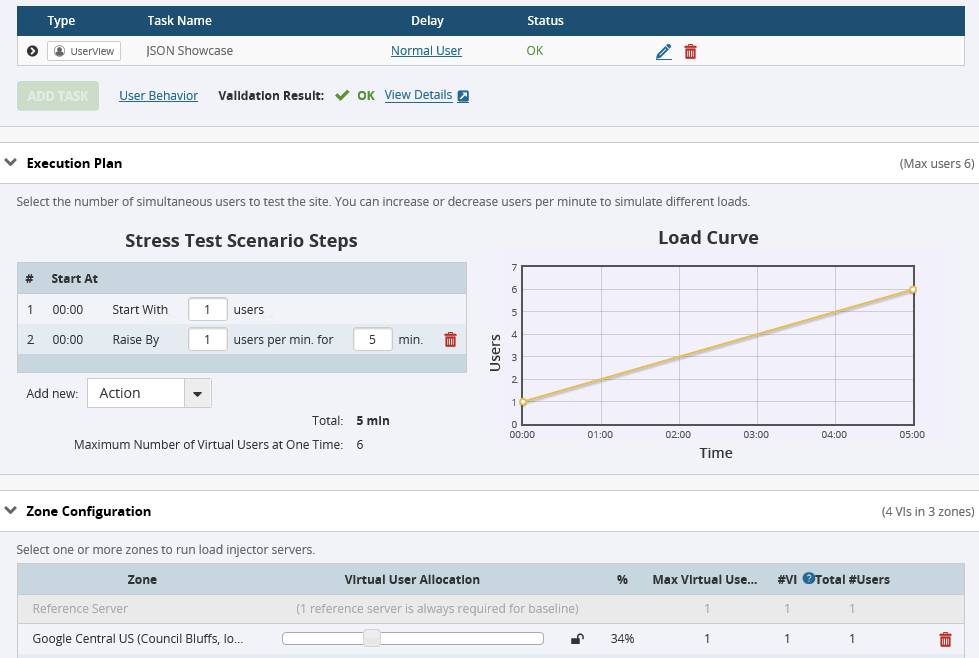
In this step, you can configure your testing plan and locations.
Run the Load Test for JSON Application
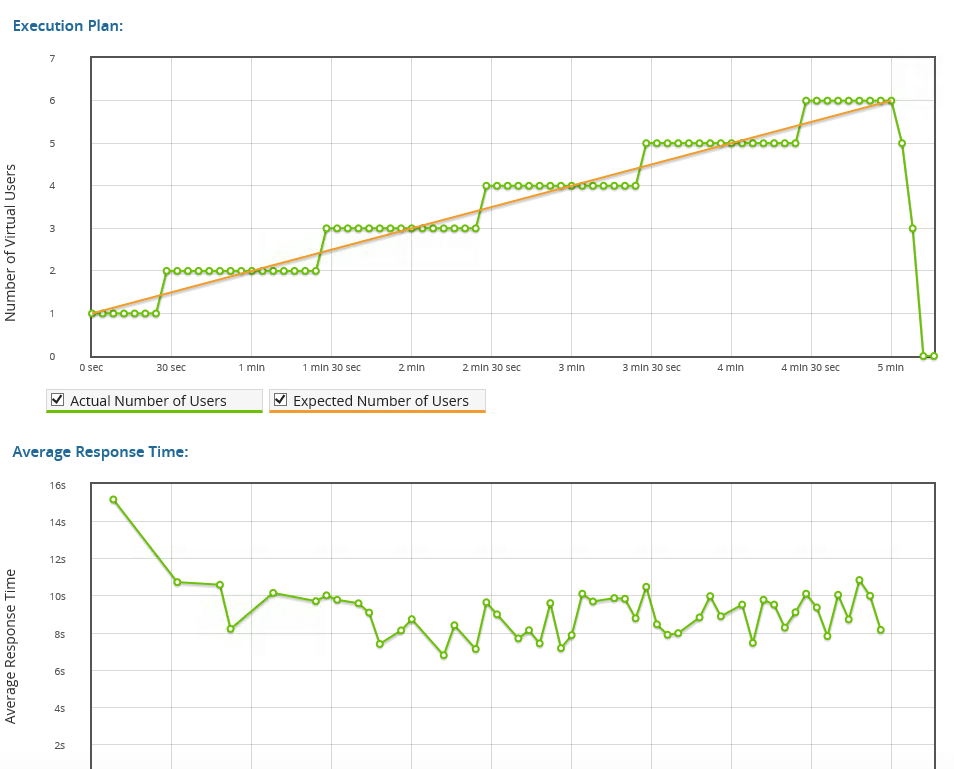
As LoadView ramps up the load, view response times of your JSON application and behavior during load test execution.
Result Analysis for JSON Application
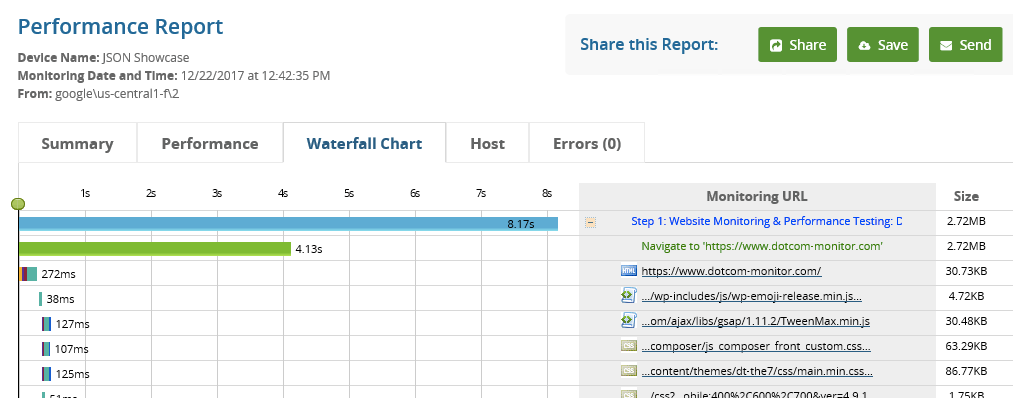
LoadView produces a waterfall chart and report that can be shared with developers to identify problems and implement changes.
Single-Page Applications (SPAs) behave more like a desktop application because they dynamically rewrite the current page instead of loading entire new pages from a server. The user experience on such SPAs is often better since there are fewer interruptions. Initial load times of SPAs are typically longer because frameworks must be downloaded. SOAP, JSON, or AJAX are frequently used for communication between SPA client and server.
Some of the most burning performance issues of SPAs include the following:
- Initial page load time is long
- Reduce the size of your frameworks
- Memory leaks
- Review memory footprint of your SPA regularly
- Data presentation
- Delay the loading of an object or data (lazy data loading)
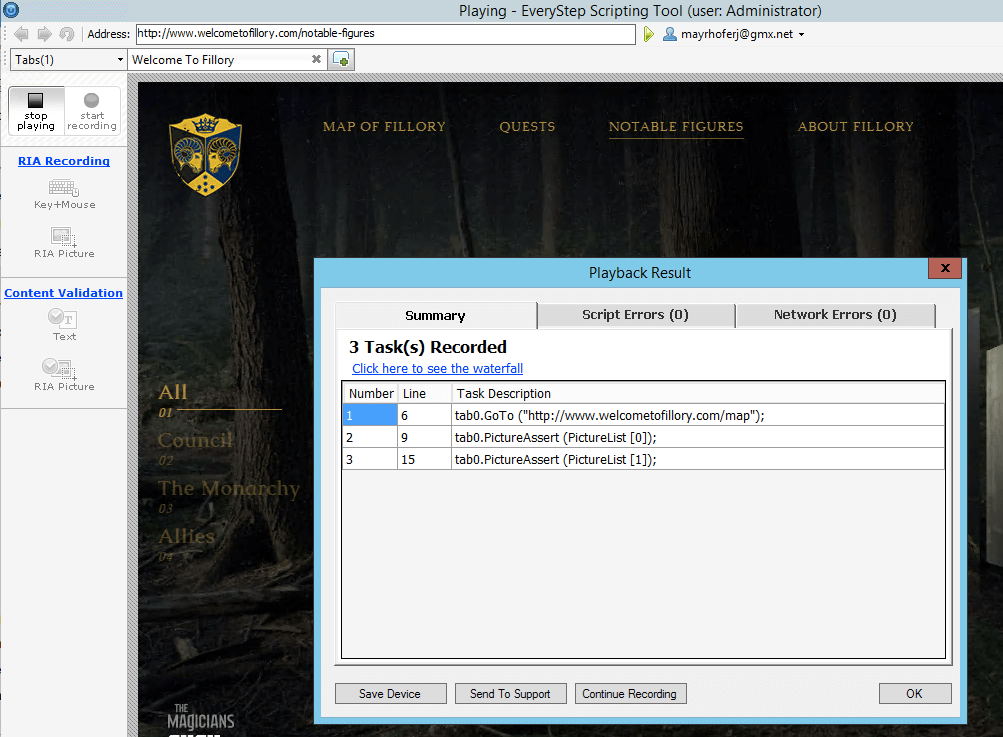
LoadView gives you everything you need when it comes to accurate SPA load testing. We’ve used the following application for this load testing showcase: https://www.welcometofillory.com/map
Description
Screenshot
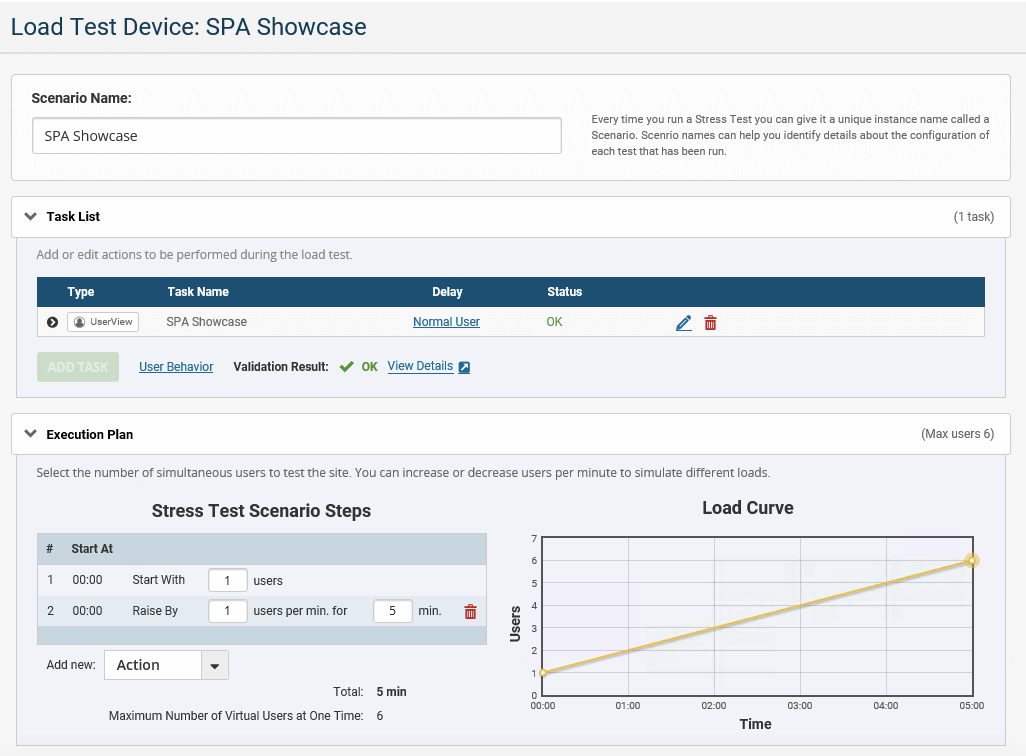
Design Load Test for Single-Page Application
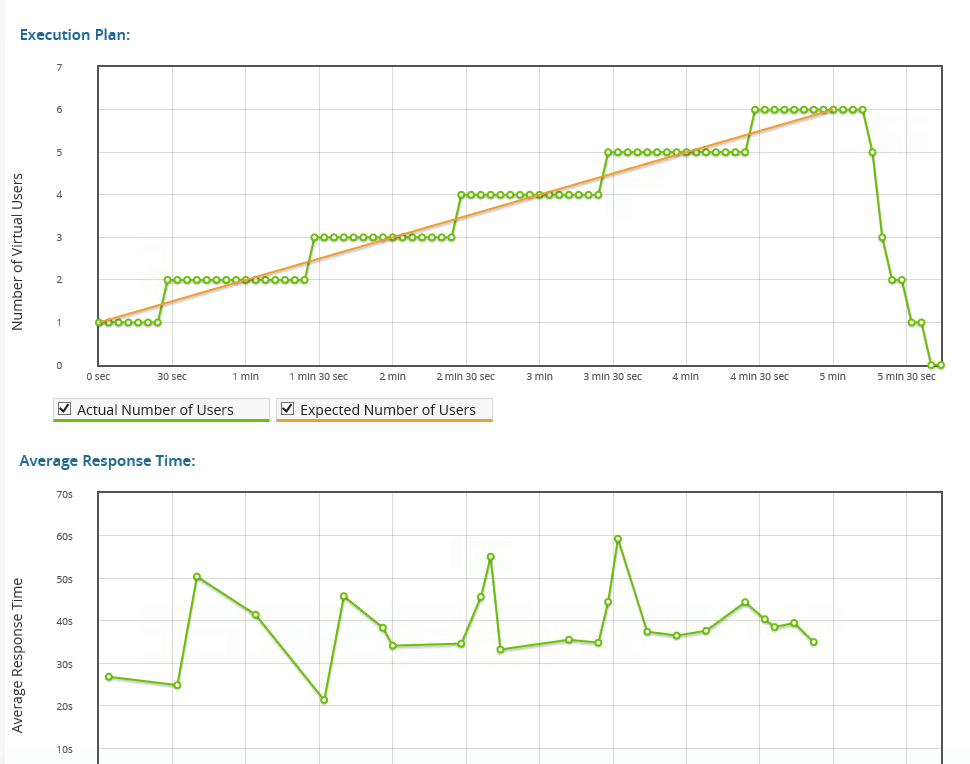
As LoadView ramps up the load, view response times of your application and behavior during load test execution.
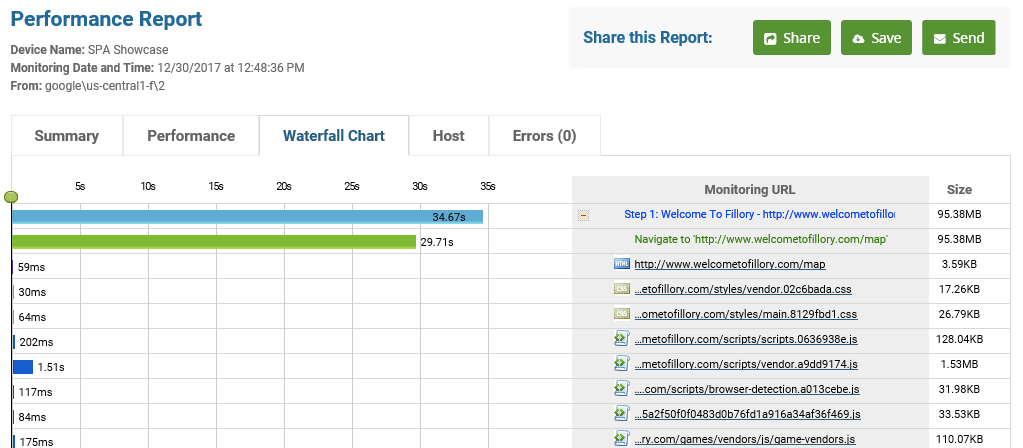
Results Analysis for your Single-Page Application
As mentioned before, the initial page load time for SPAs is often quite long. In our showcase, the download of this initial page took more than 35 seconds and the page size is more than 95 MB. Obviously, this application needs some tuning.
Simple Object Access Protocol (SOAP) is a much more than a programming language. Contrary to JavaScript, which is a development language, SOAP enables communication across any device and operating system. The basic building block of SOAP is XML. SOAP has introduced a format for sending and receiving messages.
Some of the most popular performance hotspots related to SOAP are the following:
- Chatty application
- Wrong or no caching strategy
- Serialization causes high overhead
- No input validation on consumer-side or inefficient web method processing
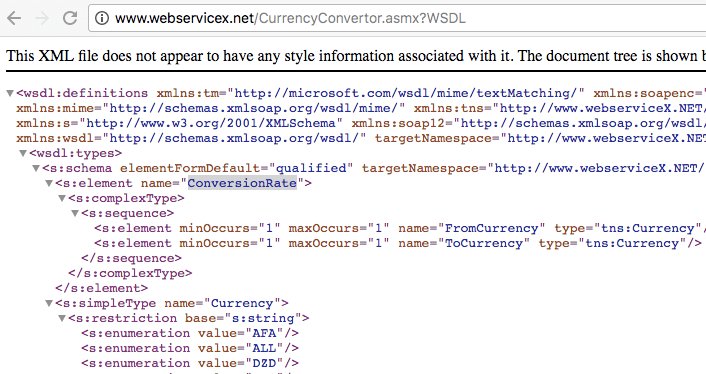
SOAP-based web services provide a description of their services in WSDL. This web service description language can be used for manual our automated testing. In our showcase below, I will demonstrate how to set up load tests of a SOAP-based application.
This simple CurrencyConverter will be used in our sample load test setup:
https://www.webservicex.net/CurrencyConvertor.asmx?WSDL
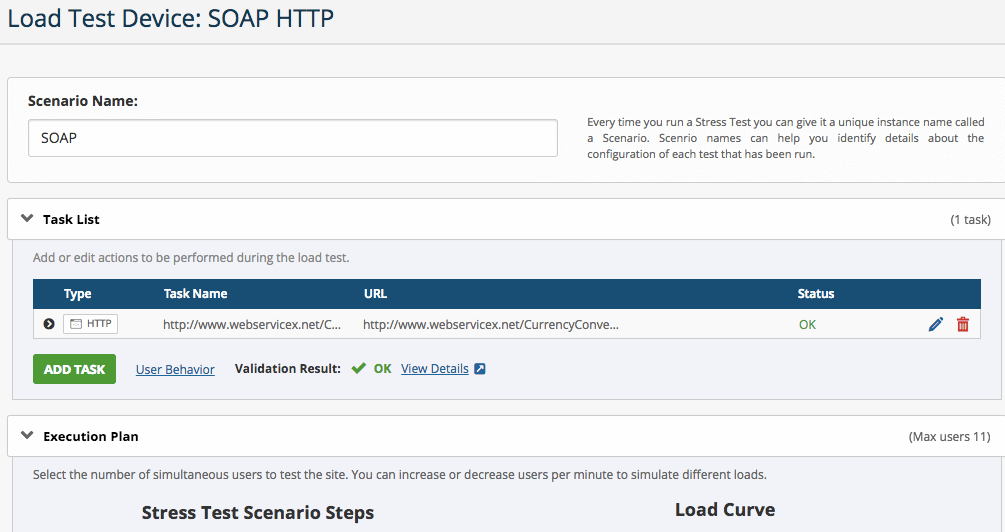
The following steps outline how to perform SOAP load testing with LoadView.
Description
Screenshot
Create the Test Script for your Application
Create an HTTP task and add the POST request details.
Design the Load Test for your Application
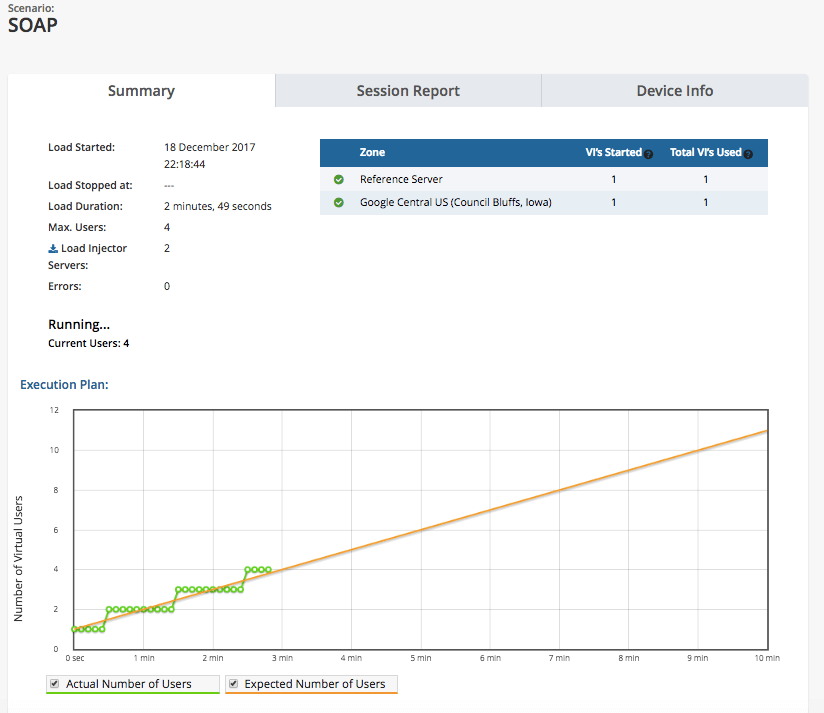
Run the Load Test for your Application
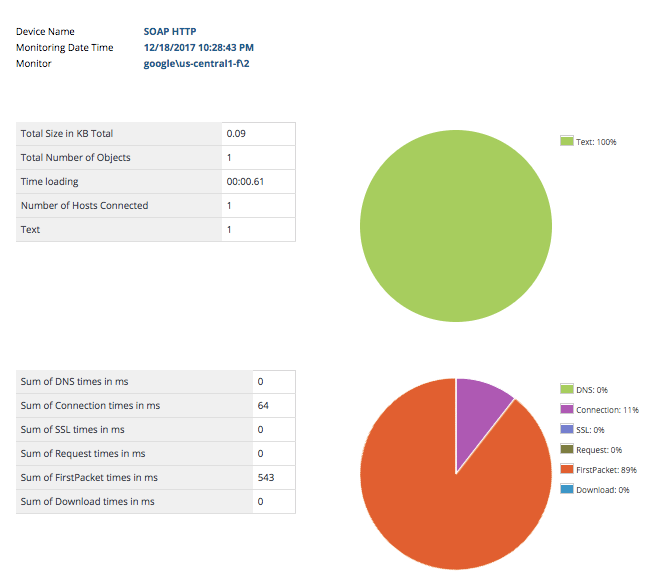
As LoadView ramps up the load, view response times of your SOAP application and behavior during load test execution.
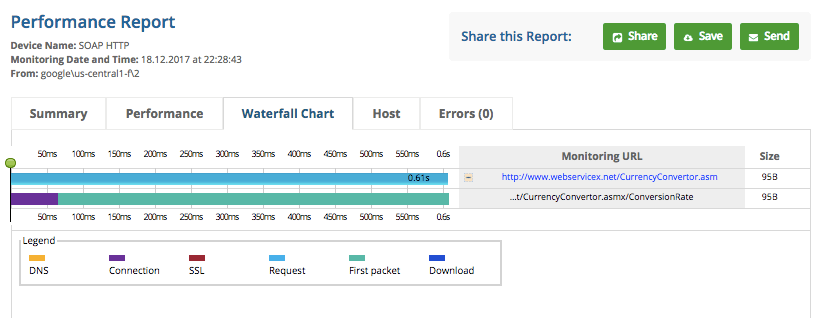
Results Analysis for your Application
REST is a widely used communication standard that stands for Representational State Transfer. It structures data in machine-readable format and makes use of XML or JSON. Contrary to SOAP, which is highly function-driven oriented, REST very data driven. RESTful API and RESTful services are two often used terms in this discipline but they mean nothing more than REST services.
Performance testing of REST services is all about sending data to services or verifying response from it. Some most common REST performance hotspots include the following:
- Chatty services
- Too much or not required data transmitted
- No reuse of TCP connections
Developer communities don’t often agree whether to implement web services in SOAP or REST. From a performance perspective, REST-based services are designed for speed. Their protocol overhead is lower and there is no XML parsing required. The case study below illustrates how Web API REST testing can be done with LoadView.
Description
Screenshot
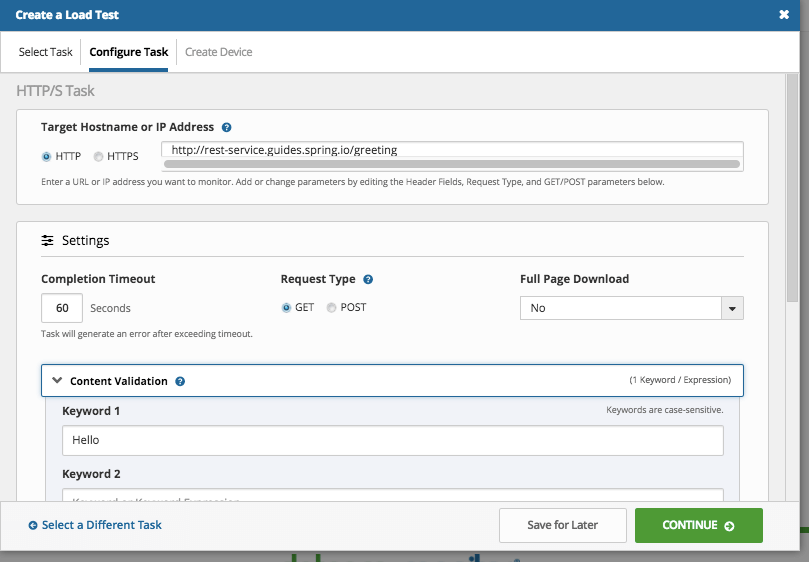
Create the Test Script for your Restful Service
Create an HTTP task
Add the GET request details
Add the keyword validation
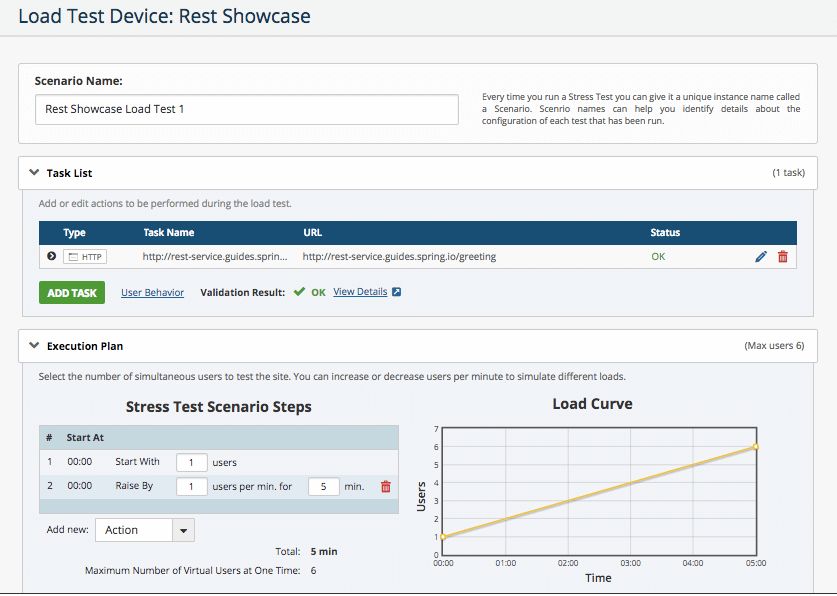
Design the Load Test for your Application
Set up the test and execution plan.
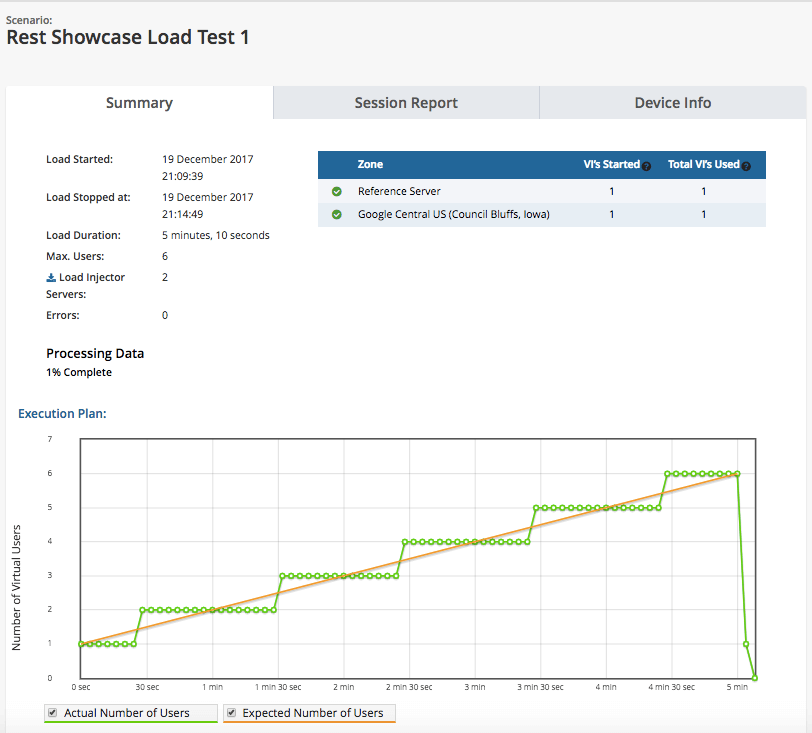
Run the Load Test for your Application
Watch the load curve as the test initiates.
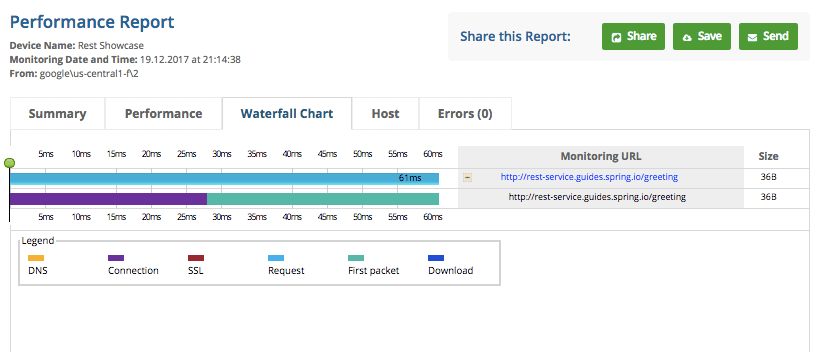
Results Analysis for your Application
Analyze the results and share with your Dev team.
WebSockets are designed to enable two-way communication between client and server, which means both parties communicate and exchange data at the same time. True concurrency and performance optimization are the two key points of WebSockets.
Advantages of using WebSockets include the following:
- Bidirectional
- No predefined message pattern, client or server can send a message to the other party
- Full Duplex
- Independent communication between client and server
- Single TCP Connection
- Upgrade HTTP connection, client and server communicate over the same TCP connection
If we compare WebSockets with REST or SOAP-based communications patterns, response times of the former are much better because WebSockets enable reuse of the same TCP connection. Research has shown that WebSocket based services are up to 10 times faster.
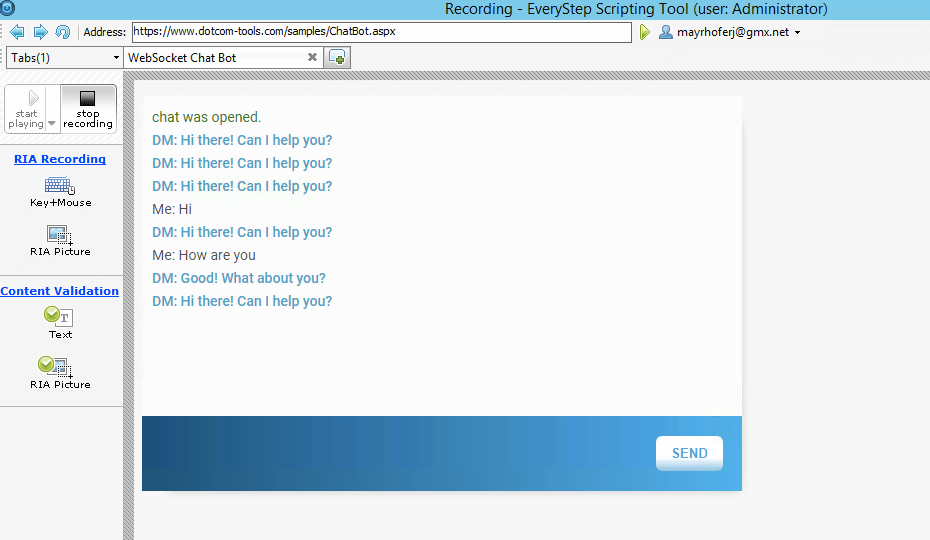
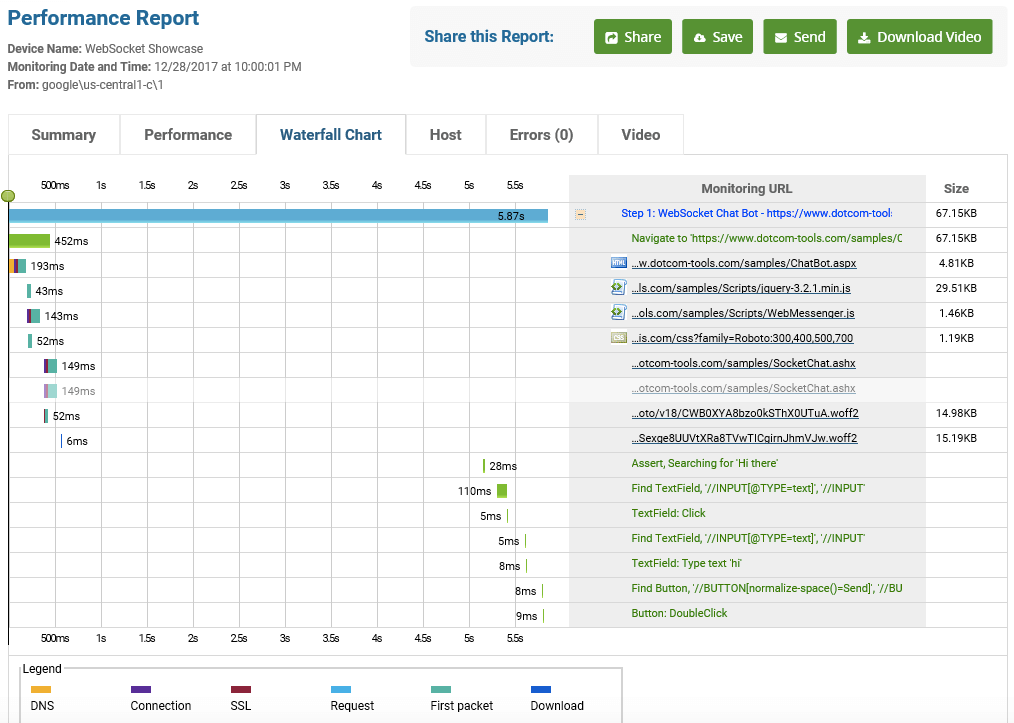
For this test, we’ll use a ChatBot which answers some basic questions.
Description
Screenshot
Record the Test Script for your WebSocket-based Application
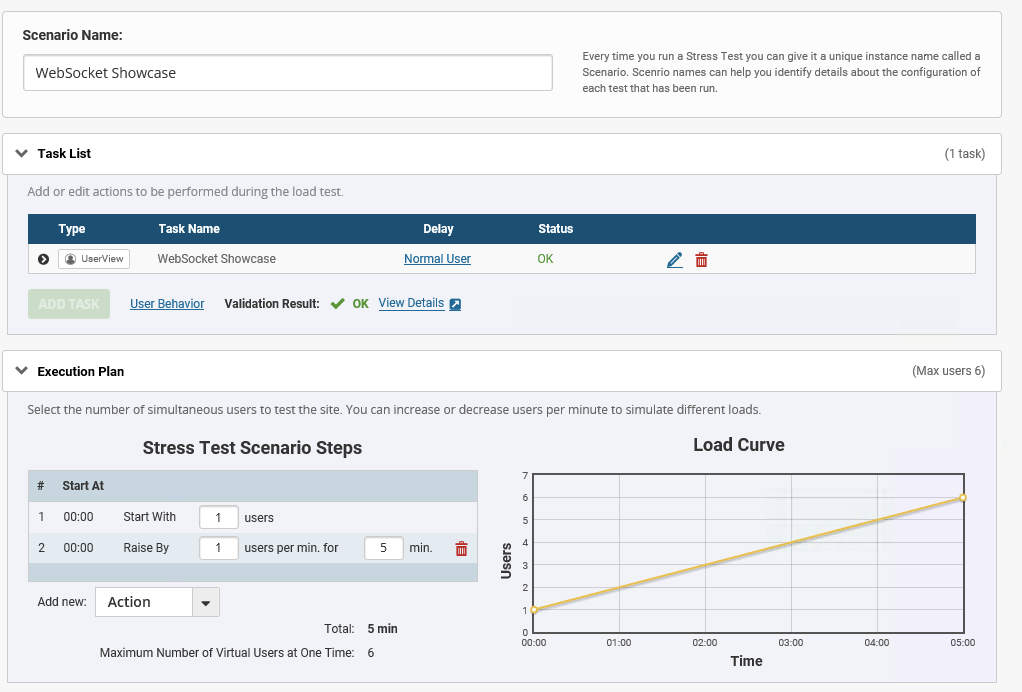
Design the Load Test for your WebSocket-based Application
Create the testing plan and distribute the load among various testing locations.
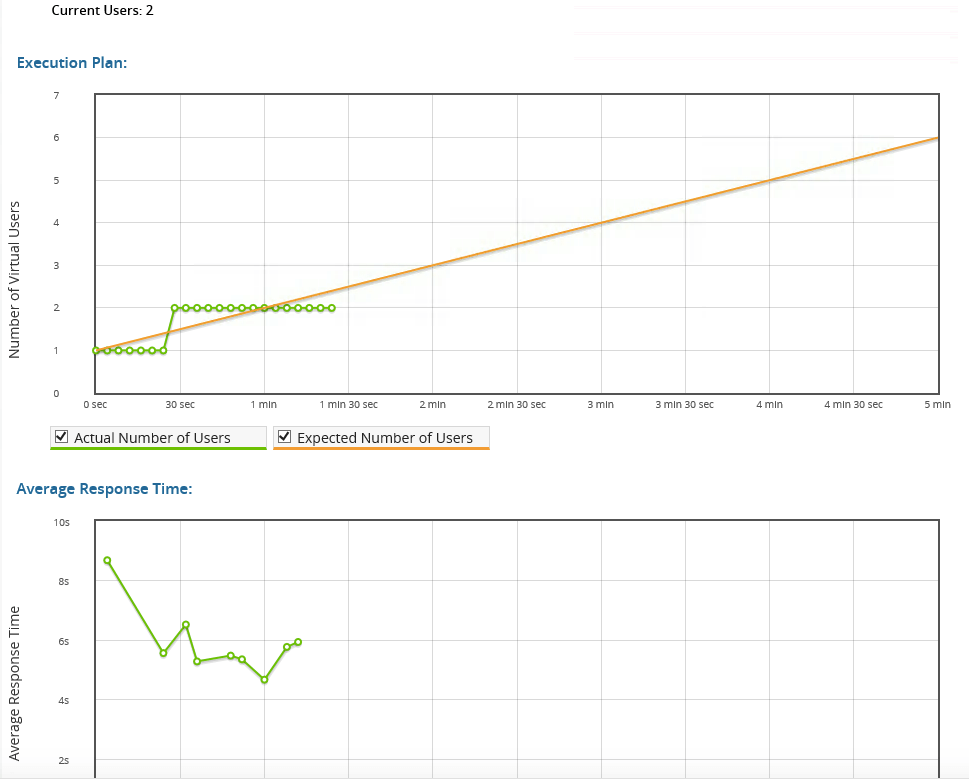
Run the Load Test for WebSocket-based Application
Results Analysis for WebSocket-based Application
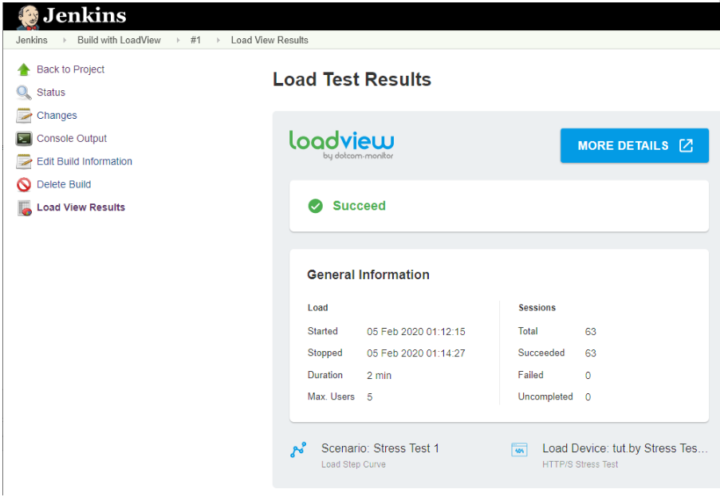
The LoadView Plugin for Jenkins allows performance testing teams to easily incorporate real browser-based load testing into their Jenkins test builds. This ensures that applications are continuously being tested and evaluated over longer periods of time, allowing teams to identity and address errors and bottlenecks before code and applications are pushed into production.
Discover performance issues earlier and release more reliable applications to production by integrating LoadView performance tests into your CI development process. Generate comprehensive test reports and gain insights into code performance.
Next Level
Experience unparalleled features with limitless scalability. No credit card, no contract.

