In our earlier article, Web Load Testing: LoadRunner vs. LoadView – Real-World Scenario, we demonstrated how to simulate a typical user journey on PhoneNumberMonitoring.com — launching the site, logging in, navigating tabs, and logging out — using both LoadRunner and LoadView. That comparison emphasized the differences in scripting effort, setup complexity, and ease of use.
Building upon that exercise, this article presents a detailed comparison of LoadView and LoadRunner, focusing specifically on test scenario preparation and reporting capabilities. We examine how each tool performs when executing a real-world user flow with multiple virtual users, and how well they handle:
- Execution visibility and accuracy
- Real-time and post-test reporting
- Dynamic content and frontend behavior
- Session-level diagnostics and debugging
Overview
This comparison focuses exclusively on the test setup experience and reporting capabilities of LoadView and LoadRunner, two leading performance testing tools.
The evaluation is based on a real user flow—launch, login, perform actions, logout—executed on a dynamic web application. The comparison emphasizes:
- Ease of configuring load scenarios
- Visibility during test execution
- Depth and clarity of test reports
- Debugging features such as video replay, screenshot capture, error classification, and waterfall analysis
As modern applications increasingly adopt SPAs (Single-Page Applications) and JavaScript-heavy frontends, tools capable of simulating true browser behaviour and offering real-time visual diagnostics are more critical than ever.
- Test Scenario Preparation
LoadView
Real Browser-Based Scenario Designer
LoadView records actual browser interactions (clicks, scrolls, waits, AJAX triggers) directly in Chrome or Edge. Each step is mapped in a visual flowchart, ensuring full alignment with user experience.
Visual Load Configuration Wizard
Easily configure:
- User load types: Load Step Curve, Dynamic Adjustment Curve and Goal-Based Curve
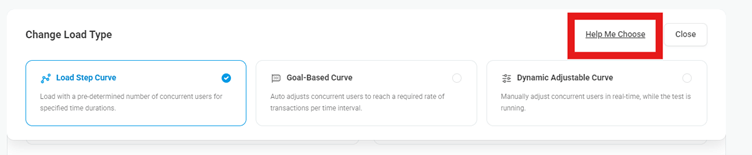
- Load patterns: Stepwise,Exponential,Spike,Load,Endurance/Soak, Failover etc
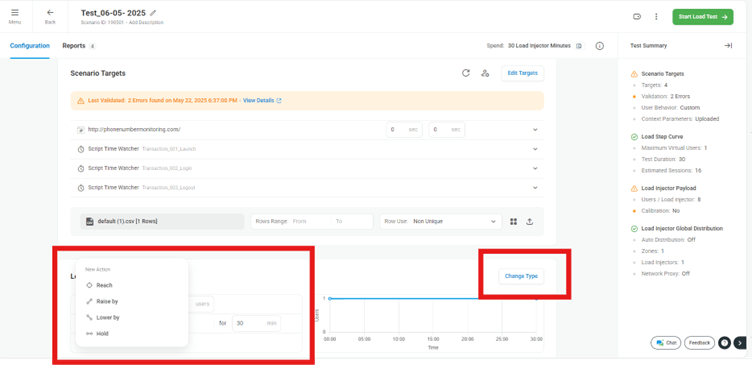
- Scenario Set up:-Test duration,Ramp up,Lower by, Hold
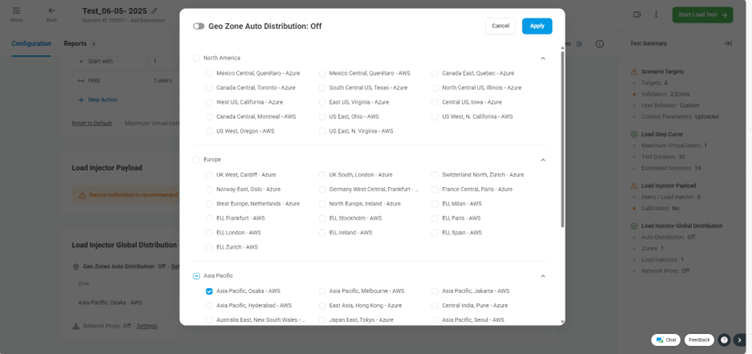
- Regions: 40+ global cloud locations (e.g., Singapore, California, London)
- Browsers: Chrome or Edge for true rendering context
Environment-Free Setup
No need to install or manage Load Generators (LGs), virtual machines, firewall rules, or network configurations. All infrastructure is provisioned automatically in LoadView’s cloud.
Step-Level Conditions
Configure pass/fail criteria for each step, such as:
- Text validation
- Element visibility
- JavaScript triggers
- HTTP status codes etc
One-Click Preview
Run a single-user preview to verify the entire test flow before executing a full test. This includes UI rendering, validations, and response metrics.
Additional Notes:
- Can provide transaction names, Delays, Measure Time, Lighthouse, Network Throttling etc.
- Branching logic, conditional waits, and looping available out-of-the-box.
LoadRunner
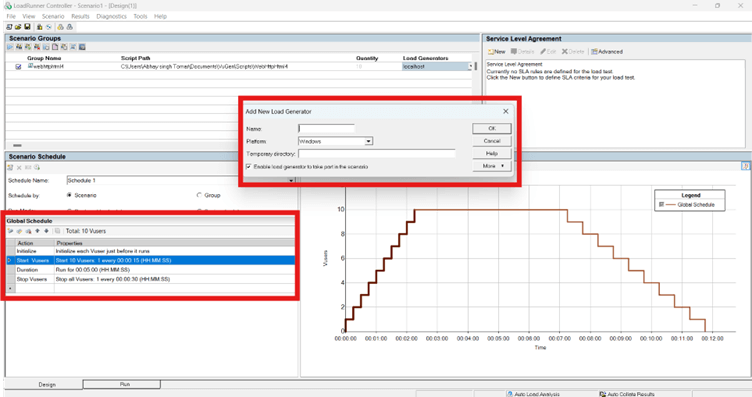
Controller-Based Scenario Design
Scenarios are created using the LoadRunner Controller by assigning:
- User groups
- Ramp-up schedules
- Think times and pacing settings
- Execution durations
Manual Load Generator Setup
Testers must deploy and configure LGs manually across machines or cloud hosts. Connectivity between LGs and Controller requires firewall/NAT settings, port allowances, and infrastructure permissions.
Geo Testing is Complex
To simulate load from multiple regions, users must manually provision servers in each target location, configure access, and synchronize test runs.
Basic Validation Logic
Step validation is based on protocol-level responses (e.g., HTTP 200). Visual validations are only possible in TrueClient scripts, which are resource-intensive and require more maintenance.
Execution Preview
Previewing test flows with UI rendering is available only in TrueClient. For other protocols, dry runs do not include visual confirmation of test paths.
Additional Notes:
- Requires scripting and protocol expertise
- Protocol selection (Web HTTP/HTML, SAP, Citrix, etc.) affects script design
- Real-Time Execution Visibility
LoadView
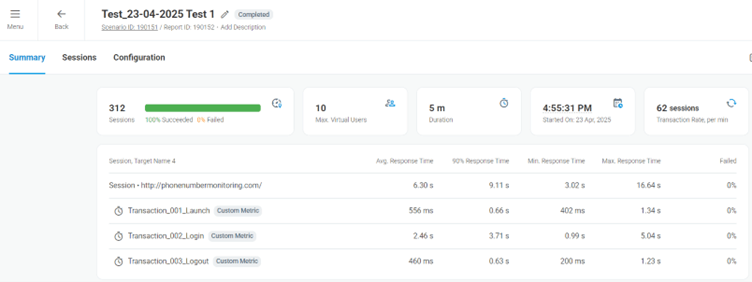
Rich, cloud-hosted reports accessible in real-time: Live performance metrics are displayed continuously as the test runs.
Continuous real-time update of performance KPIs: Metrics such as average response time, 90th percentile, minimum, maximum, and failure rate update in real time.
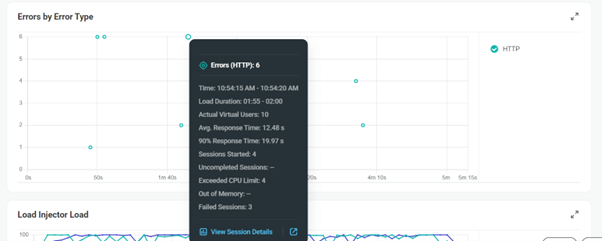
Error classification for quicker root cause analysis: Errors are grouped into validation, client, server, and third-party categories.
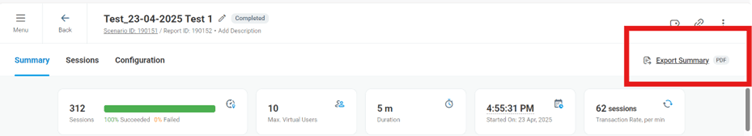
Cloud-based PDF and shareable dashboard links: Easily distribute live dashboards or export summaries to share with teams.
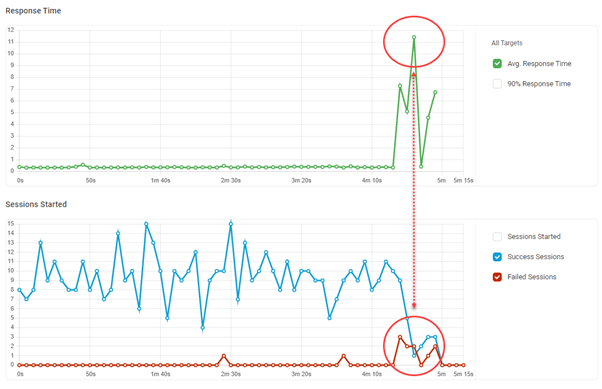
Interactive charts for response times, error distribution, and virtual user activity: Enables quick identification of spikes, trends, or failures. A comprehensive summary view to monitor test progress in real-time.
The top half shows a sudden spike in average response time, which correlates (see red arrows) with a drop in successful sessions and rise in failed sessions (bottom graph). This is an ideal example of LoadView’s ability to visually correlate performance degradations with user session behavior.
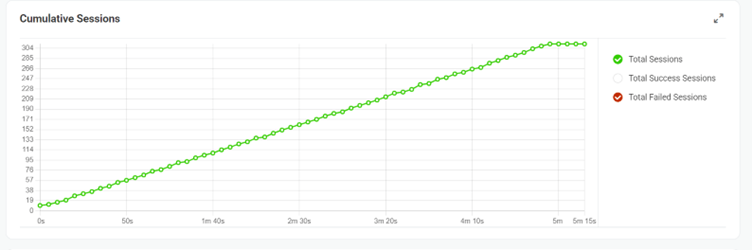
Cumulative session tracking across time windows: Helps assess test consistency and stability throughout the execution period.
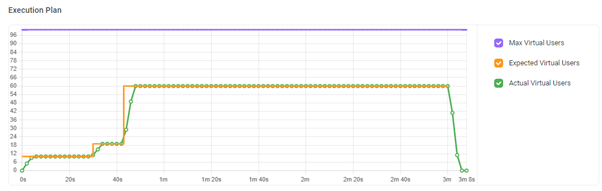
Virtual user ramp-up curves: Visual representation of load increases aligned with session performance.
This graph displays how virtual users were scaled over time. The green line shows the actual number of users executed, closely matching the orange line (expected users), proving stable ramp-up and ramp-down behavior. The purple line marks the maximum configured limit for virtual users.
Server statistics from each geo-zone: Diagnose region-specific issues or latency.
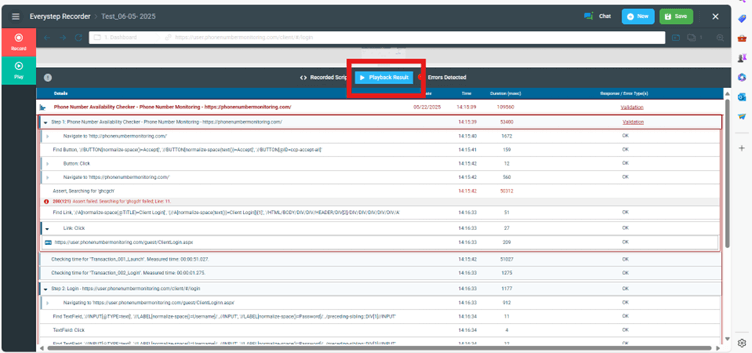
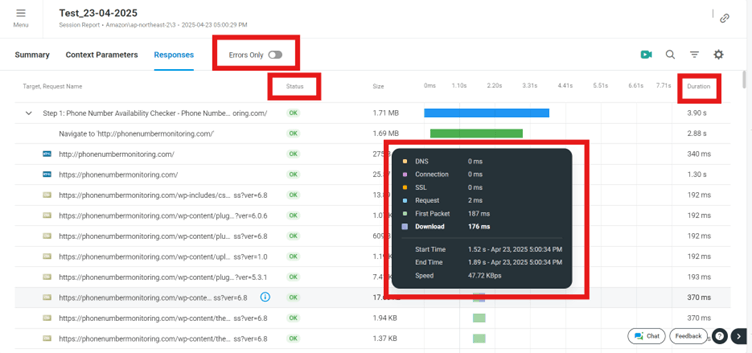
Session-wise navigation showing individual user journeys: Drill into any virtual user’s path and associated response data.
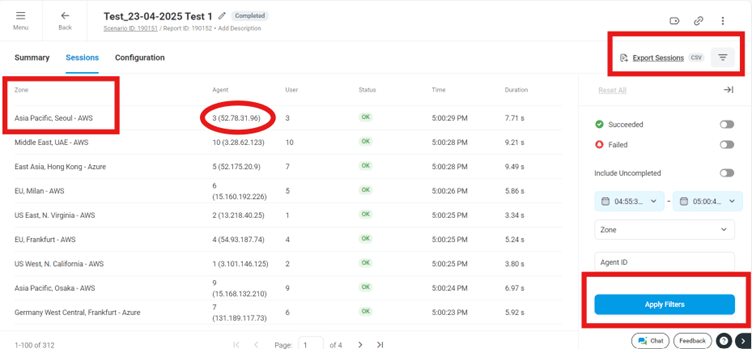
Drill into specific session IDs: Inspect individual test journeys and can see Detailed network-layer insights per user and Rapidly isolate the source of errors for quicker resolution.
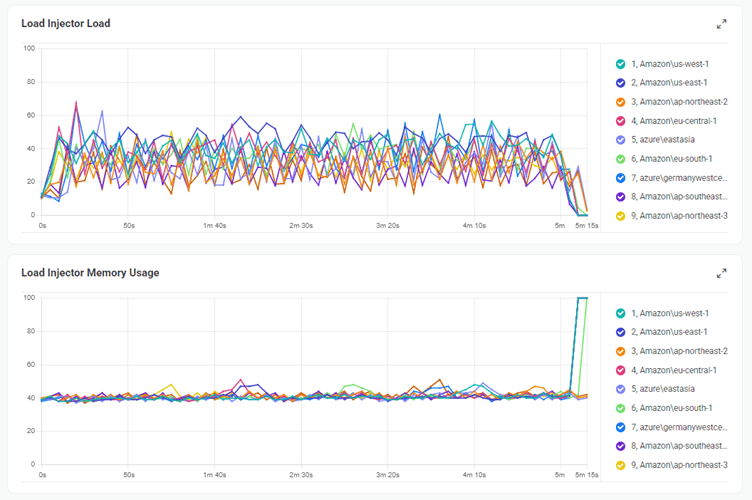
This shows how multiple cloud agents (from AWS, Azure regions) shared the test load. The CPU and memory remained mostly balanced throughout, verifying LoadView’s elastic test distribution architecture.
Historical Test Run Comparison in LoadView
Compare Results Across Multiple Test Executions
While real-time and static reporting are valuable, LoadView also offers historical trend tracking out of the box. Each test run is archived automatically and can be compared with previous executions.
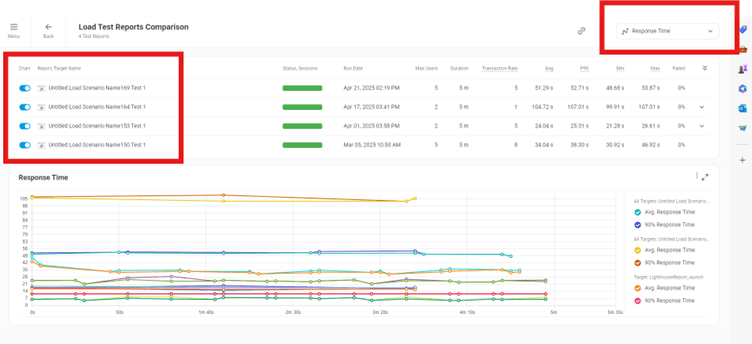
Before/After Performance View
This allows teams to evaluate changes made to application code, infrastructure, or third-party services by directly comparing previous performance baselines with the latest results — without complex integration or configuration.
No Setup Required
Unlike LoadRunner, which typically requires integration with external tools like InfluxDB, Grafana, or HP ALM for trend analysis and historical comparison, LoadView provides built-in historical visualization through a simple, web-based interface — with no additional setup or infrastructure required.
Example: A development team can compare a test from two weeks ago (before a database optimization) with the latest execution and immediately see improvements in response time and error rates.
Additional Benefits:
- QA teams can validate flows functionally and visually
- Reduces debugging effort by avoiding log analysis or backend-only views
LoadRunner
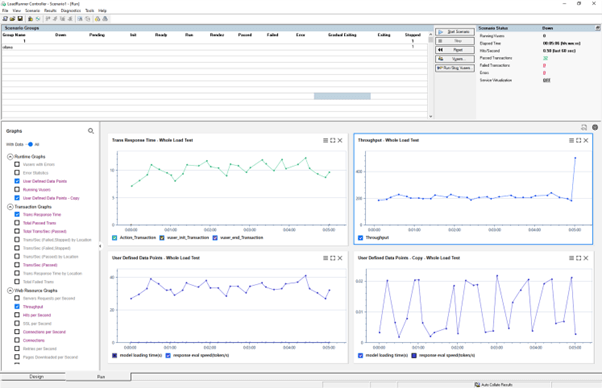
Controller Graphs (Licensed Edition Only)
When licensed, LoadRunner Controller provides runtime metrics like:
- Running VUsers
- TPS (Transactions Per Second)
- Errors per second and few others
These graphs are not available in the free edition, significantly limiting visibility during execution.
No Frontend Feedback
Screenshots, visual validations, and DOM-level data are unavailable unless TrueClient is used. Even with TrueClient, these insights are harder to analyze under high load.
No Geo-Based Breakdown
Out of the box, LoadRunner does not provide region-wise performance segmentation. Custom scripting or tagging is required.
Session-Level Monitoring Absent
LoadRunner does not offer per-session insights, making it difficult to track which step failed, what the browser rendered at the time, or how the session progressed through its execution path.
Additional Limitations:
- No built-in screenshot capture
- No real-time session data
- Root cause analysis delayed until post-run report in Analysis tool
- Summary Comparison Table
| Feature | LoadView | LoadRunner |
| Scenario Builder | Visual, browser-based | Script and protocol based (Controller) |
| Geo Load Setup | Built-in, cloud-managed | Manual LG deployment needed |
| Session-Level Visibility | Full, with replays and screenshots | Absent |
| Waterfall Chart | Yes, browser-level | Not Available |
| Video Playback | Yes | No |
| Frontend Metrics (FCP, LCP, TTI, CLS) | Yes | No |
| Error Categorization | Auto-grouped by type | Manual log parsing |
| Report Sharing | Cloud dashboards, PDF, Excel,Sharing Links | Local HTML or PDF only |
| Historical Result Comparison | Built-in | Requires ALM/external setup |
| Stakeholder-Ready Reporting | Yes, business friendly | Technical only |
| Environment Setup | Cloud-hosted, no infra required | Requires setup of Load Generators |
| Best Use Case | Web apps, UX, modern frontend | Backend APIs, protocol-level testing |
Best Use Cases for LoadRunner (Protocol-Level Testing)
LoadRunner is a powerful, enterprise-grade performance testing tool best suited for backend-heavy, protocol-based testing. It simulates traffic at the transport layer, making it ideal for applications where browser rendering is not required.
| Use Case | Why LoadRunner Works Well | Example |
| 1. API Load Testing | Supports various protocols like HTTP, Web Services, and REST. Allows precise parameterization and correlation. | Load testing a banking or insurance API handling high-volume transactions |
| 2. SAP, Oracle, Citrix Testing | Offers protocol-level support for complex enterprise systems like SAP GUI, Oracle Forms, and Citrix. | Performance testing SAP HR system workflows |
| 3. Backend System Load Testing | Effective for stress testing messaging queues, databases, and legacy mainframes. | Load testing a COBOL-based financial reporting backend |
| 4. CI/CD Pipeline Integration | Integrates with Jenkins, Azure DevOps, and ALM for automated regression and performance testing. | Run nightly performance tests after code merge |
| 5. Complex Protocol Testing | Simulates FTP, SMTP, WebSocket, and Telnet interactions with protocol accuracy. | Load testing file upload performance in an internal FTP server |
| 6. Custom Scripting with C | Full C-language scripting enables granular test design, logic, and data handling. | Simulating multi-step insurance claim process via coded scripts |
Best Use Cases for LoadView (Real Browser-Based Testing)
(Chrome, Edge) to simulate actual user behavior, making it ideal for modern web applications and teams that prioritize user experience and visual validation.
| Use Case | Why LoadView is the Best Fit | Example |
| 1. Browser-Based Load Testing | Executes real user journeys with JavaScript, cookies, DOM updates, and page rendering. | Load testing a travel booking portal |
| 2. SPA Testing (React, Angular, Vue) | Automatically handles async behavior (AJAX, fetch, websockets) from JS frameworks. | Testing a customer dashboard in Angular |
| 3. E-Commerce UX Validation | Measures load time, FCP, LCP, TTI — actual metrics impacting conversion rate. | Load test a cart-to-checkout flow before Black Friday |
| 4. Geo-Distributed Testing | Supports testing from 40+ locations to mimic user access from different regions. | Test site speed from US, Europe, and India |
| 5. No Scripting Load Testing | Record flows like a user (clicks, scrolls, filters, navigation). No technical scripting needed. | Product managers or QA teams test user flows without dev input |
| 6. Stakeholder-Ready Reports | Reports include session replays, visual charts, PDF exports — suitable for business/non-technical users. | Share results with VPs, product owners, or clients |
| 7. Dynamic Content Validation | Captures every UI change, delayed rendering, modal windows, or AJAX-based filters. | Testing a hotel listing site with filters and lazy-loading |
Summary from the Article
LoadView offers a modern, browser-based testing experience optimized for dynamic web applications. It enables:
- Real-time access to live metrics and performance graphs during test execution
- Deep session-level insights with video playback, screenshots, and full interaction replays
- Easy report sharing through cloud dashboards, PDFs, and Excel exports
- Simplified debugging with built-in browser metrics (FCP, LCP, TTI), geographic breakdowns, and auto error classification
LoadRunner, while robust for protocol-based enterprise systems, delivers:
- Limited UI visibility and no built-in frontend metrics
- Post-execution reports without real-time dashboards or session replays
- Reporting capabilities often reliant on third-party integrations (e.g., ALM, InfluxDB, Grafana)
- TrueClient scripting required for browser simulation, increasing test complexity and system load