You may be wondering, “How can I utilize JMeter for performance testing?” Fear not, as this article is here to guide you through it. We’ll delve into what JMeter entails, explore its pros and cons, and then demonstrate how to use JMeter for load testing. Keep reading to uncover more!
What is Apache JMeter?
Apache JMeter, often simply called JMeter, is a popular open-source tool built entirely in Java. It’s widely used for load testing, functional behavior testing, and performance evaluation. Many developers and software teams rely on JMeter because it comes with detailed documentation, a strong community for support, and plenty of best practices to guide you. Being open-source and cost-effective, it’s a go-to choice for many. However, since it’s built entirely in Java, setting it up and getting started with tests may take a bit more time and effort for your team.
At its core, JMeter is all about helping you test and measure the performance of web applications and services under different loads. It enables you to analyze the data collected during tests and generate reports that reveal how your application behaves under stress. This can help you identify bottlenecks, gain insights into potential areas of improvement, and ensure your application is ready to handle real-world traffic.
Like any tool, JMeter comes with its own set of pros and cons. Understanding these will help you determine whether JMeter is the right fit for your load testing needs, based on your project’s goals and constraints. Let’s explore the advantages and disadvantages of using Apache JMeter as a load testing tool.
Advantages of JMeter Load Testing
- Open Source: JMeter is entirely free, allowing developers access to the source code.
- Platform Independent: JMeter is 100% Java-based and can operate on various platforms.
- Support for Multi-Protocol: JMeter caters to both web application testing and database service performance evaluations. It covers fundamental protocols like HTTP, JDBC, LDAP, SOAP, JMS, and FTP.
- Record & Playback: JMeter facilitates the recording of user activity on a browser, which can be simulated and played back.
- Customizable Reporting: Test results can be visualized in diverse formats, including charts, tables, trees, and log files.
- Community Support: JMeter boasts a substantial community offering help, guidance, and tutorials.
Disadvantages of JMeter Load Testing
- Protocol-based Load Tests: JMeter is limited to executing protocol-level tests, making it unsuitable for testing JavaScript-based applications such as Angular, Ember, Knockout, etc., or AJAX-based applications. Since modern browsers heavily rely on JavaScript and AJAX for performance, this limitation hinders a comprehensive understanding of website or application performance. JMeter lacks the ability to render HTML like a browser, creating a significant gap in fully grasping the user experience under load.
- System and Hardware Limitations: JMeter demands installation on a local machine, necessitating users to ensure they meet hardware requirements and undergo a potentially time-consuming setup. This process may involve additional investments in hardware. Running large-scale tests can quickly deplete system resources or lead to errors. Moreover, as tests are conducted locally, performance engineers face limitations in assessing performance from diverse geographic locations or user bases.
- Complex UI: JMeter is a complex solution and not user-friendly like other load testing tools. For new users, navigating its complex features can be daunting, requiring a significant learning curve. The multitude of components and functions demands a higher level of knowledge before efficiently building and executing tests. This complexity serves as a barrier for engineers and developers seeking a more streamlined and intuitive setup for load tests.
- Limited Cloud Scaling by Default: JMeter runs locally unless configured for distributed testing. Modern performance testing often requires cloud-based load generation to simulate global users, which typically requires additional setup or third-party platforms.
Perform Load Tests with JMeter
Using JMeter for performance testing offers several advantages that make it a preferred choice among developers and testing professionals. But load testing with JMeter doesn’t have to be difficult. We’ll cover how to use JMeter for performance testing, specifically how to use JMeter for load testing. Load testing requires thorough research and planning. It’s essential to establish your test requirements, scope, and criteria well in advance of setting up the load test. This may involve gathering data from diverse sources, such as analytics tools for traffic statistics, session durations, and peak-hour visitor counts. Additionally, reviewing past campaign data can provide insights into the anticipated load or concurrent users to test against your site or application.
It’s crucial to build a plan that matches your specific environment and simulates real-world scenarios as closely as possible. Once you have your plan in place, you can start setting up your test plan in JMeter, which comprises different elements. A fundamental JMeter load test typically includes a Test Plan, a Thread Group, and Samplers.
Create a JMeter Test Plan
Follow the steps below and ensure that the requirements are met for setting up a JMeter Test Plan.
1. Adding a Thread Group
The Thread Group signifies the concurrent users needed for the load test. To access the Thread Group, right-click on Test Plan, choose Add, then select Thread (Users), and finally, opt for Thread Group.
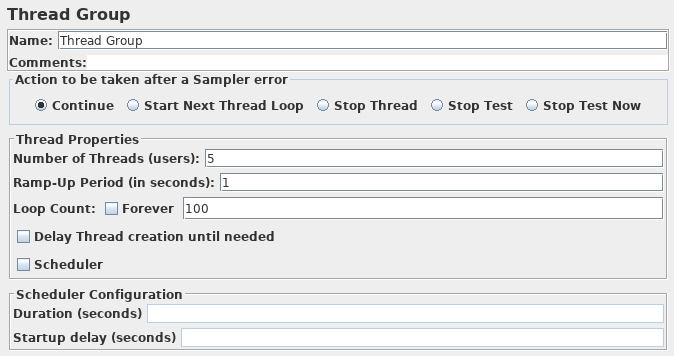
From the Thread Group properties dialog box, you can also set the following properties:
-
- Number of Threads (Users)
- Ramp-up period (in seconds)
- Loop Count (how many test iterations)
- Additional actions, like delays, test start and stop times, and actions to take after a Sampler error.
Alternatively, instead of starting with the Thread Group, you can choose from a variety of test templates by accessing File > Templates > Select Templates or selecting the Templates icon from the Tool Bar.
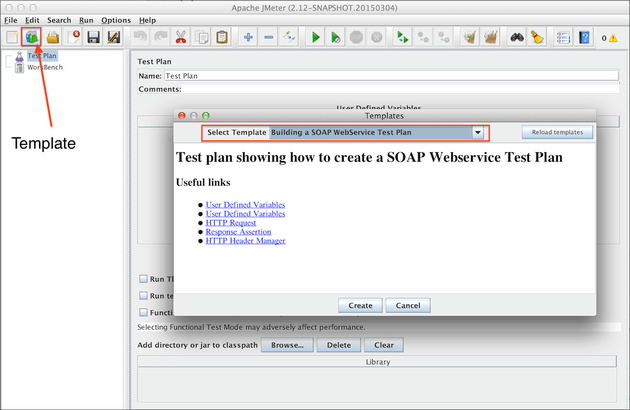
At this point, you have an array of template choices available, encompassing options like web services tests, Web Test Plan, Functional tests, and more. These templates come pre-equipped with all the essential elements, sections, and fields required for constructing the test plan.
2. Configure the Sampler
Samplers enable JMeter to dispatch various types of requests, such as HTTP (for a website, application, or API), FTP, SMTP, TCP, along with other request types. To access the Samplers, right-click on Thread Group, choose Add, then select Sampler, and pick the Sampler that aligns with your specific test requirements.
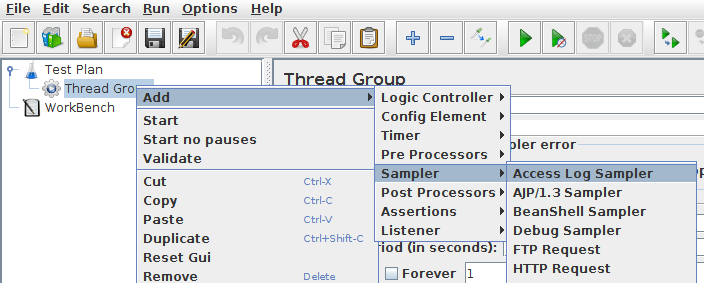
In the Configure Sampler section, you are prompted to enter additional details, including:
- Protocol (HTTP/S)
- Server Name or IP
- Path (for a specific web page)
- Type of request (GET, POST, HEAD, PUT, etc.) for API load testing.
3. How to Configure Listeners
Listeners enable you to examine the outcomes of the Sampler. To access Listeners, go to Thread Group, select Add, then Sampler, and finally, Listener.
Choose from a variety of over 15 Listeners, each presenting the same data but with distinct visual displays. Furthermore, you can incorporate more than one Listener into the JMeter Test Plan. Examples of available Listeners comprise the Summary Report, Aggregate Graph, View Results Tree, View Results in Table, Simple Data Writer, BeanShell Listener, and many others.
4. How to Record Load Test Scripts (Optional)
For a straightforward HTTP or protocol-level load test, proceed to the next step and run your JMeter load test. However, if you need to configure a test that simulates a particular user’s actions and paths, the HTTP(S) Test Script Recorder is necessary. Remember that this process captures HTTP traffic, not recording the script from an actual browser. Here are the steps you need to follow:
- Add the Recording Controller (located in the Thread Group)
- Navigate through your site or application
- Record your actions via HTTP/S requests
Alternatively, you have the choice to employ the JMeter Proxy Server. While this option enables script recording from a browser, the setup process can be time-consuming. To utilize the JMeter Proxy Server, follow these steps:
- Navigate to your system’s proxy settings
- Import the JMeter certificate
- Configure the proxy settings
5. Run the JMeter Test
Once you have configured your Listener(s), your JMeter Test Plan is finally ready, and you can run your JMeter load test. There are a couple of different ways to run your JMeter test, but make sure you save your test plan first.
- Option 1: Select the green triangle/arrow to run the test.
- Option 2: Select the Run button in the Tool Bar.
6. Review and Analyze your JMeter Test Results
As your JMeter test runs, you can monitor the results in real-time. For instance, if you chose the View Results in Table option, you will observe the results being displayed for each run or user execution. The results will also encompass additional metrics, including:
- Time (in milliseconds)
- Status (shows valid responses and errors)
- Bytes and Bytes Sent
- Latency
- Connect Time
Analyzing these results allows you to pinpoint errors and identify areas with potential slow load times. Furthermore, comparing your JMeter test plan with the test results provides valuable data for making performance improvements and optimizations. You can also opt to conduct additional load tests with an elevated load. However, as previously outlined in some of the disadvantages, particularly concerning the scale of load tests, JMeter has limitations and may not be suitable for large-scale tests. In such cases, a modern load testing solution like LoadView proves more effective than utilizing JMeter.
Using JMeter in CI/CD Pipelines (2026 Best Practice)
Many teams now automate JMeter tests inside CI/CD pipelines using tools like Jenkins, GitHub Actions, or GitLab CI. Running load tests during builds helps teams detect performance regressions early and ensures applications remain stable as new features are deployed.
Common CI/CD integrations include:
- Running JMeter tests as part of nightly builds
- Triggering performance tests after major deployments
- Exporting JMeter results to monitoring tools like Grafana or Prometheus
By incorporating JMeter into CI/CD workflows, teams can move performance testing earlier in the development process and maintain consistent application reliability. Automating these tests helps identify performance bottlenecks before they reach production, supporting faster releases and more stable deployments.
Load Testing Alternative: LoadView
By now, you should have a good understanding of JMeter, including its strengths, limitations, and performance testing capabilities. While JMeter is a powerful and free open-source tool, setting up load tests can be a bit time-intensive, with numerous steps and configuration options that often require significant preparation.
If you’re finding that JMeter doesn’t fully meet your needs, it might be worth exploring other load testing tools that offer more advanced features tailored to your business goals. The good news? Even if you’re already using JMeter, you can easily integrate your JMeter load tests with LoadView to take advantage of its extensive features and benefits.
Up next, we’ll walk you through the steps to set up a JMeter load test using LoadView. This integration allows you to streamline your testing process and get the most out of both tools!
Setting up a JMeter Load Test with Loadview
1. Save your JMeter Script
Within your JMeter application, save your JMeter test plan to a JMX file on a local computer.
2. Log into LoadView.
If you don’t have a LoadView account, creating one is quick and straightforward. When you sign up, we’ll provide you with up to 5 free complimentary load tests to begin with!
Log in to your LoadView account and select the JMeter testing type option.
3. Import your JMeter Script
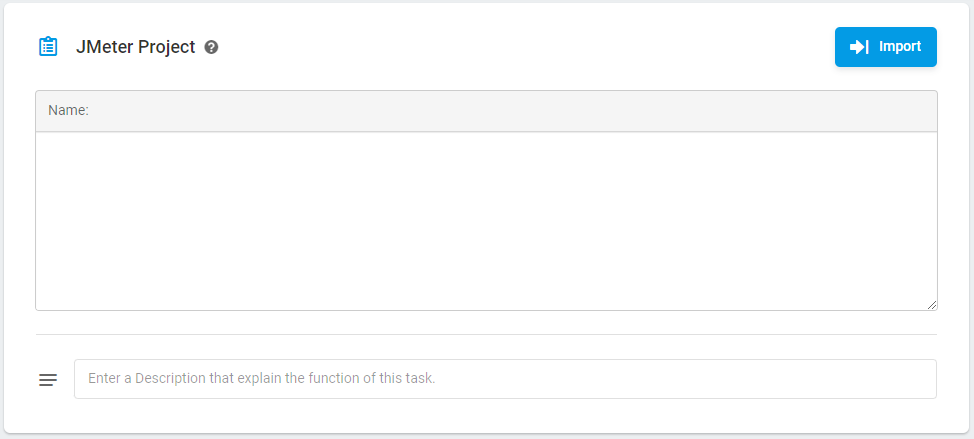
Navigate to the Configure Task page and choose “Import” to bring in your JMX file. The XML content of the file will appear in the JMeter Project field. Request parameters will be automatically converted into the LoadView JMeter Project during the import process, encompassing the following parameters:
- Target URL or IP
- Path to an endpoint
- Request type
- Request headers
- Text assertions
Overcome Your JMeter Load Testing Limitations with LoadView
Note: LoadView does not import Thread Group settings into the LoadView JMeter Project. Configure Thread Properties, such as the number of threads and ramp-up period, by setting up a load test scenario in LoadView. If needed, you can also edit the XML code in the field.
Alternatively, within the Settings field, you have the choice to define the execution timeout for the test session. LoadView awaits a response from the target resource within the specified time, and if the execution time surpasses the limit, the system concludes the session and issues an error. Leaving this field blank defaults to a timeout limit of 120 seconds.
4. Create Device
Click Create Device and continue with the load test execution scenario.
5. Configure Your Test Execution Plan
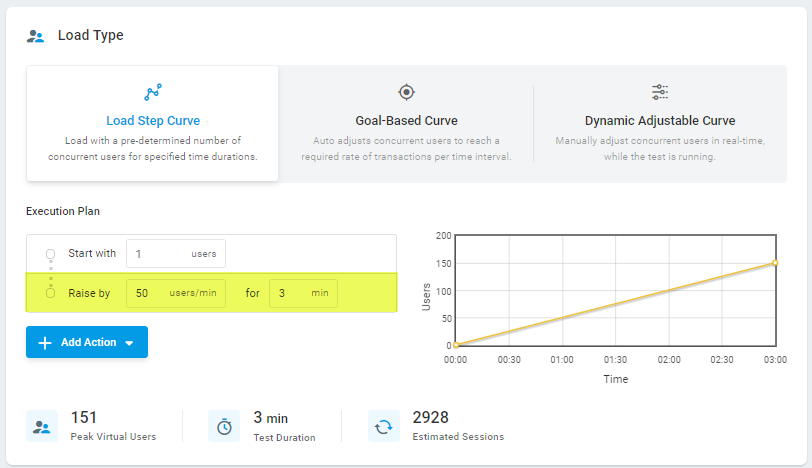
After importing your JMeter Test Plan, the subsequent step involves configuring the test execution scenario. If your JMeter Thread Group has Thread Properties configured, and you wish to maintain the same load pattern in LoadView, indicate the corresponding Load Type parameters as per the provided recommendations. Alternatively, you can select from various load curve options in the Load Type section, catering to your specific testing needs.
6. Run Your Load Tests and Analyze Results
After thoroughly configuring your load test plan, initiate your JMeter load test. The test progresses through several stages, including initialization, launching load injectors, and executing the test. Upon completion, you’ll receive a notification and can access your load test results on the Load Test Results page.
If you need any further information or help, feel free to contact our team. Our team is available 24/7 to assist with all your load and performance testing needs.
You can easily utilize a free open source tool like JMeter to perform your load tests but to elevate your load testing efforts, it’s worth looking at an alternative that provides more. With that said, LoadView stands out as a leading paid performance testing solution, presenting a range of features. These include a user-friendly point-and-click script recorder, access to a global network of load injector servers, and the ability to configure diverse load curve scenarios for enhanced testing flexibility. In contrast to JMeter, LoadView requires no additional infrastructure considerations as everything is seamlessly managed. Unlike JMeter, which is limited to protocol-level load tests, LoadView employs real browsers, allowing you to assess actual performance for critical sites, applications, and APIs. LoadView also offers other versatile testing options, such as whitelisting static proxy IPs or utilizing an on-site agent enabling you to test applications behind firewalls. Experience the power of LoadView firsthand by giving it a try today with your free trial!