Load testing is one of the most crucial forms of performance testing. Its main purpose is to understand how a system behaves under a foreseen load. Bad performing web applications can damage your business, revenue, conversion rate, bounce rate, and reputation. Understanding the busiest hours or time frames for your business, and preparing for that kind of load on your system while automating the whole process can be cumbersome. To satisfy that non-functional requirement of serving users, your website, applications, web services, or APIs in under few seconds, is essential in increasing conversion rate while lowering abandonment rates. Testing your system under a heavy number of concurrent users and investigating the breaking point, or bottleneck, (CPU, memory allocation, or network), of the software and the hardware that it’s installed on, gives businesses a great insight to improve their serve times. Load testing doesn’t always need to start after the minimum viable product release. If started on a module or function basis in early times of development, it has lots to offer in terms of diminishing the risks before launching.
Load Testing for Different Web Interfaces
Tools like Pagespeed or developer tools may give limited insight on how your website behaves for a specific request. The LoadView platform is an excellent asset in your toolbox to understand where bottlenecks exist so you can fix them quickly.
Load Testing Websites
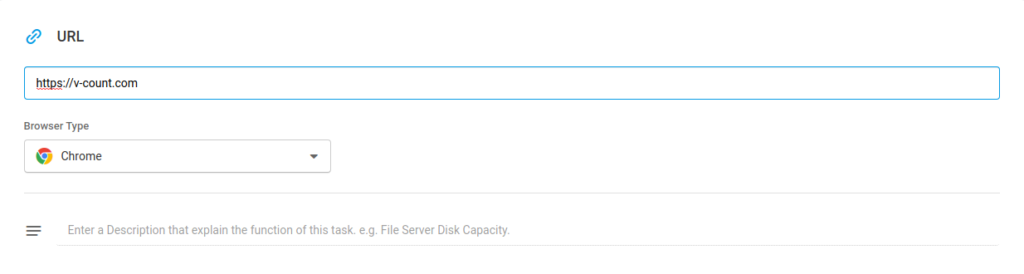
This option is suitable for testing a single web page for concurrent users. The URL field is the web page that is going to be load tested. Different browser types can be selected (Chrome, Firefox, Internet Explorer for desktop – iOS, Android, Windows Phone and Blackberry for mobile).
Load Testing Web Applications
Concurrent users performing a series of scripted actions in Chrome. Using this option, web applications can be tested to create prerecorded scripts and feed this script to load test the application.
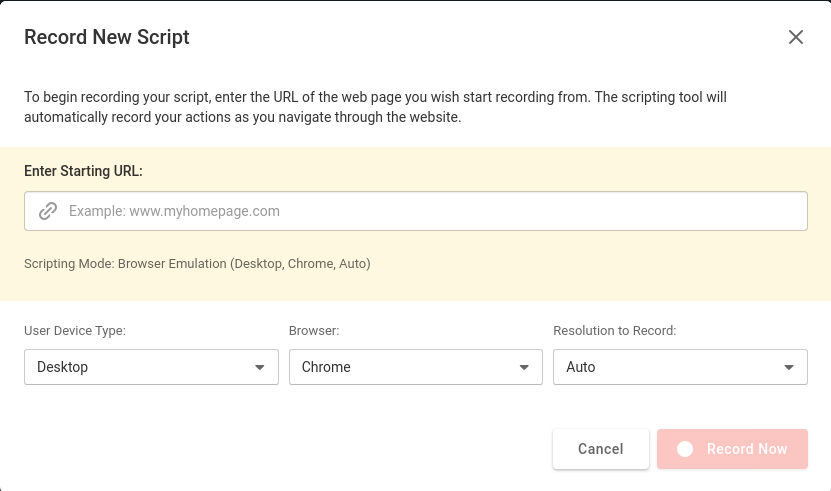
For instance, an e-commerce basket checkout functionality can be easily load tested using a prerecorded script. The steps you need to take are the following:
1) Enter a starting URL (homepage, product page, search result page, etc.)
2) User device type (mobile or desktop)
3.a) If it is a desktop device, browser type should be selected (Internet explorer, chrome)
3.b) If it is a mobile device, device type should be chosen (from a wide variety of mobile devices)
4) Resolution to record (for mobile device type, landscape or portrait modes are available)
With all required fields entered, clicking the record now button starts the recording session. It browses to the starting URL and lets you interact with the website. From now on, you can simulate a user behavior, such as finding a product from the site, adding it to the basket, and proceeding to the checkout page.
After all desired steps are simulated, clicking stop pauses the script.
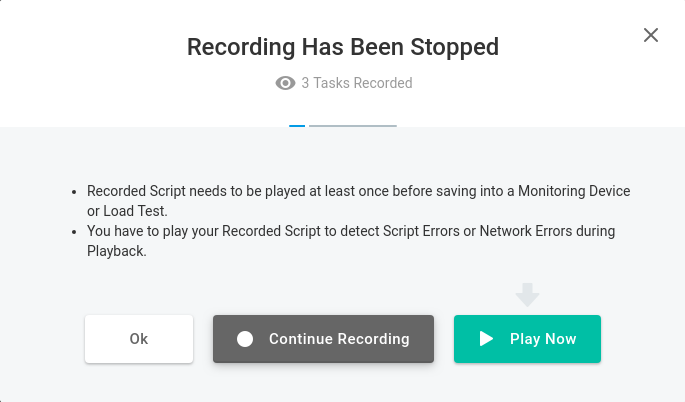
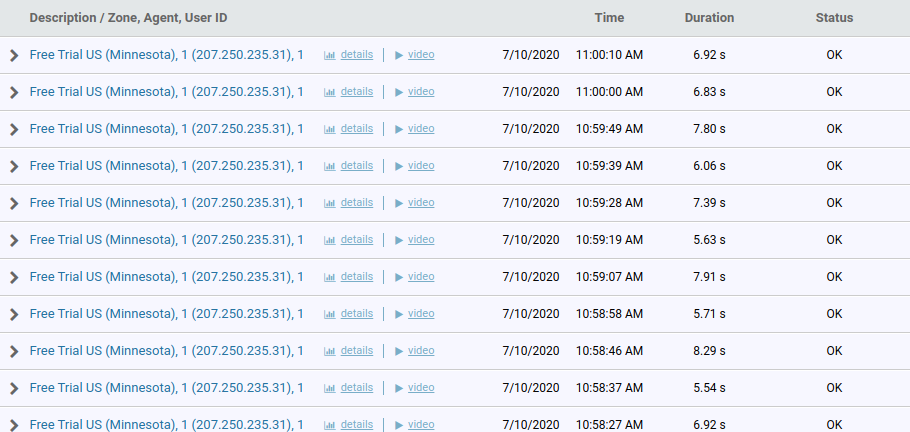
You can either continue recording script from where you left off using the “continue recording” button or save the script clicking play now. As the screenshot indicates, recorded scripts should be played at least once to check for errors if there are any before saving. After playing the recorded script once, a popup indicates that everything is in place, and interactions that were saved as a script were successfully played. Therefore we can proceed to save it.
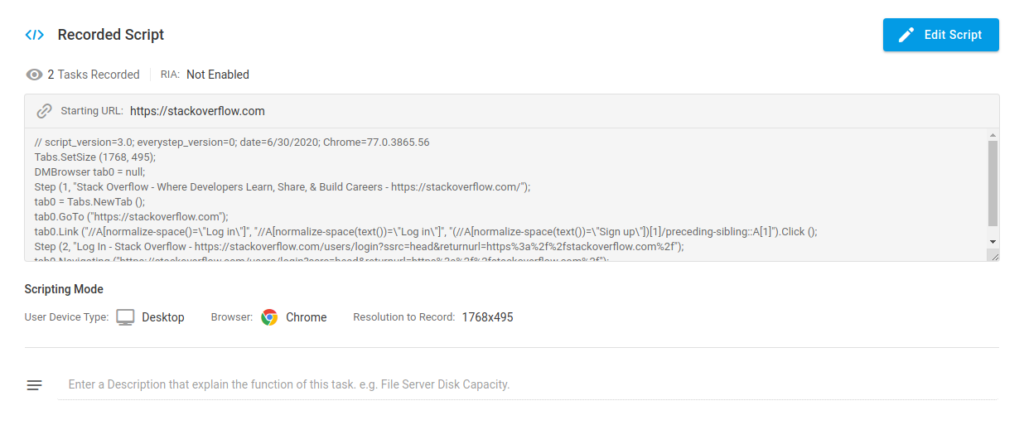
Script recording settings are saved and now we can move to additional device settings.
Here you can configure various additional settings for your device.
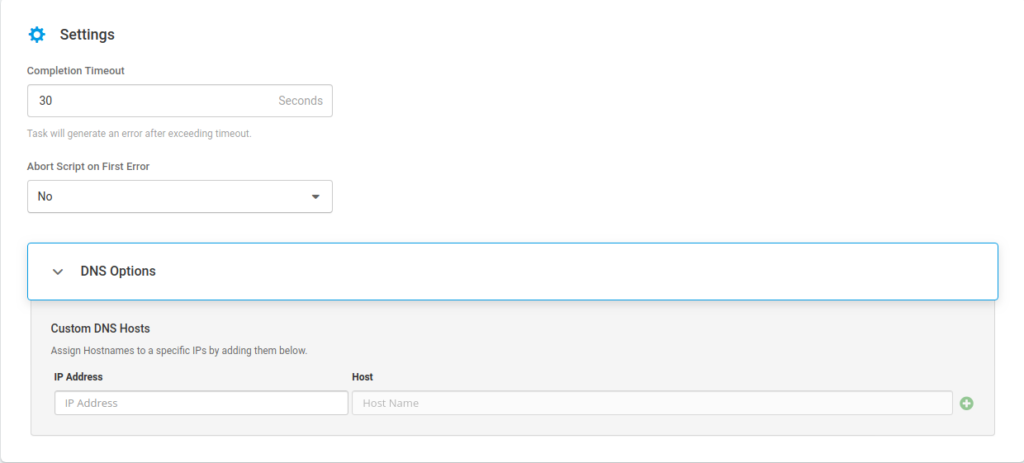
Completion timeout: if the script gets stuck somewhere in the execution plan, a fixed amount of completion timeout will let your script throw an error.
Abort script on first error: if this option is set to yes, the script will abort itself on the first error. Otherwise, it will retry again the step it failed to accomplish.
DNS Options: using this option, you can create custom domain name — IP mappings, which is great for testing code in development.
Load Testing APIs
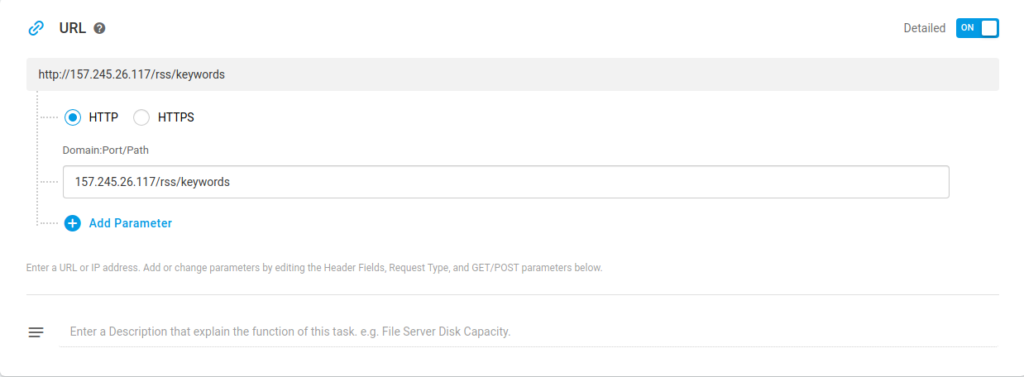
Similar to the website option, there is a URL field, where you should enter the endpoint of the API that is going to be load tested. HTTP or HTTPS can be selected for the protocol.
Additional device settings for API load testing:
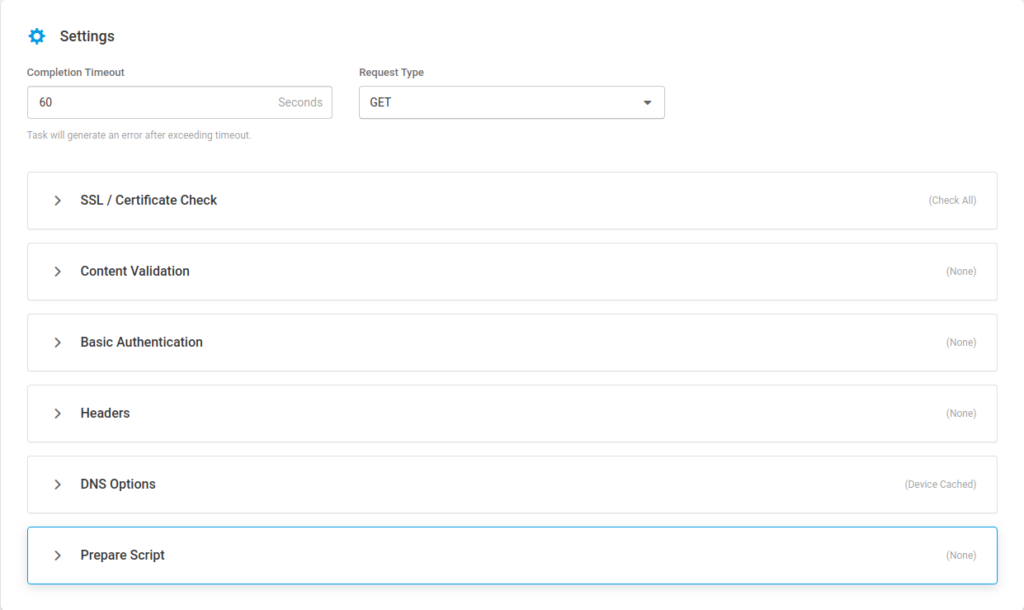
1. Completion timeout: If the request takes more than entered amount of seconds, it will throw an error.
2. Request Type: All http request methods can be tested( GET,POST,PUT,PATCH,DELETE,HEAD,OPTIONS,TRACE,PATCH)
3. SSL/Certificate Check.For an HTTP task, multiple SSL options are available:
3a. Authority: whether the root certificate is trusted or not
3b. Common Name (CN): checks the URL and certificate common name matches or not
3c. Date: checks the certificate expiry date
3d. Revocation: checks if the SSL chain has a revoked certificate or not.
3e. Usage: checks whether there is an improper use of an intermediate certificate
3f. Client certificates can be installed on a monitoring agent.
4. Content validation: Content can be searched for specific keywords and be configured to throw an error if the required specifications are not met. Many keywords can be grouped together using logical operators: {[(«keyword1» & keyword2) | !«keyword3»]}
5. Basic authentication: Username & password-based authentication
6. Headers: Custom headers can be set for the API request. (Header Name = Value)
7. DNS Options: Assign custom hostnames to specific IPs using the DNS option.
Load Testing SOAP Services
Using this device, you can load test XML based web services. Similar input fields like the REST API device is present.
URL: Url of the SOAP service.
SOAP Action: This field can be used to indicate the intent of the request. The empty string “” is translated as the intent of the SOAP message is given by the URI. No value is translated as no intent for the request.
Basic Authentication: Username and password-based authentication for the SOAP web service.
Headers: Customized headers can be sent using key-value pair.
Content Validation: Content can be searched using keywords.
DNS Options:
1. Device cached: Device cache will be used for DNS resolving. This cache information is retrieved from the previous task.
2. Non-cached: Each execution will inquiry the DNS servers.
3. TTL cached: If the device cache is missing the needed address, the local DNS server will be used.
4. External DNS Server: Given IP address will be treated as a DNS server.
Setting Up Load Tests
LoadView offers three different ways of setting the curve of load that your system is going to encounter. These different options provide a great customization ability for various complex use cases to experiment on.
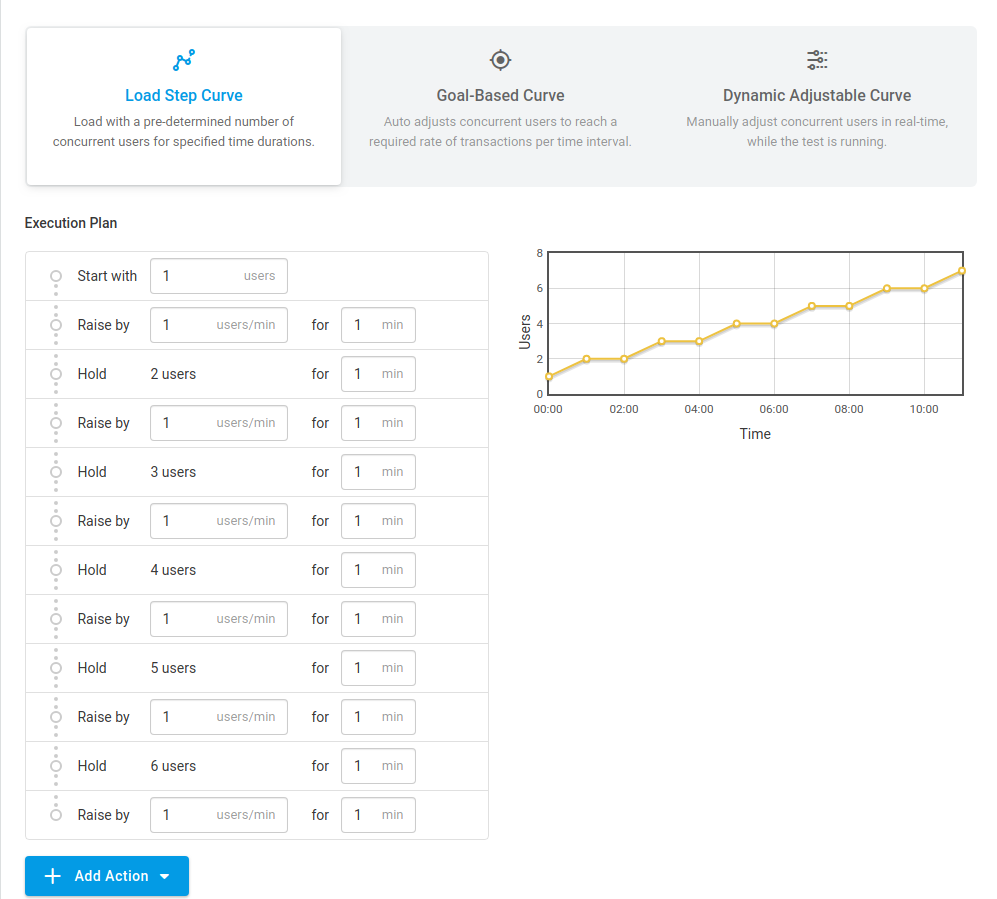
Load Step Curve
Load step curves are great for testing for the raw amount of users. You can increase, decrease, or hold for a number of users for the desired amount of minutes.
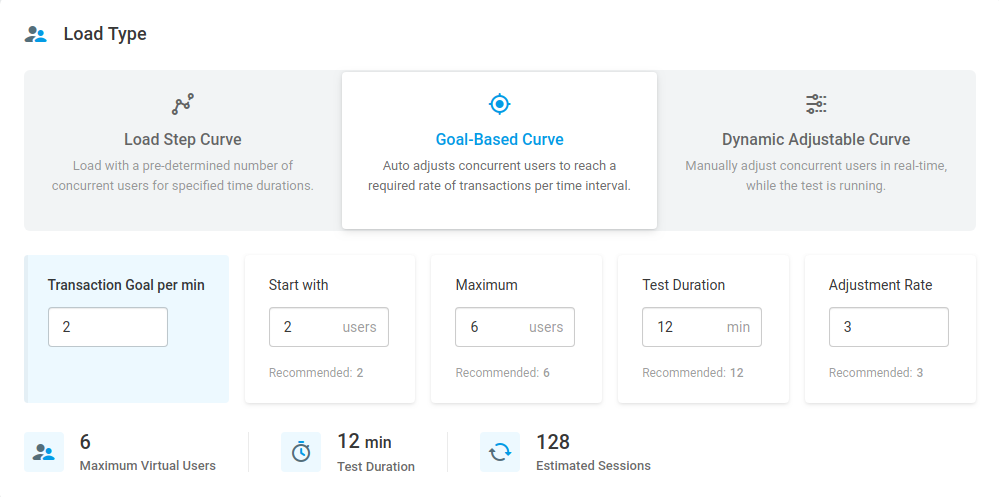
Goal-based Curve
Instead of setting the predetermined number of concurrent users, a goal-based curve helps set the number of users to reach a transaction/goal amount per minute. These transactions can be lead generation, basket orders, sign up actions, etc.
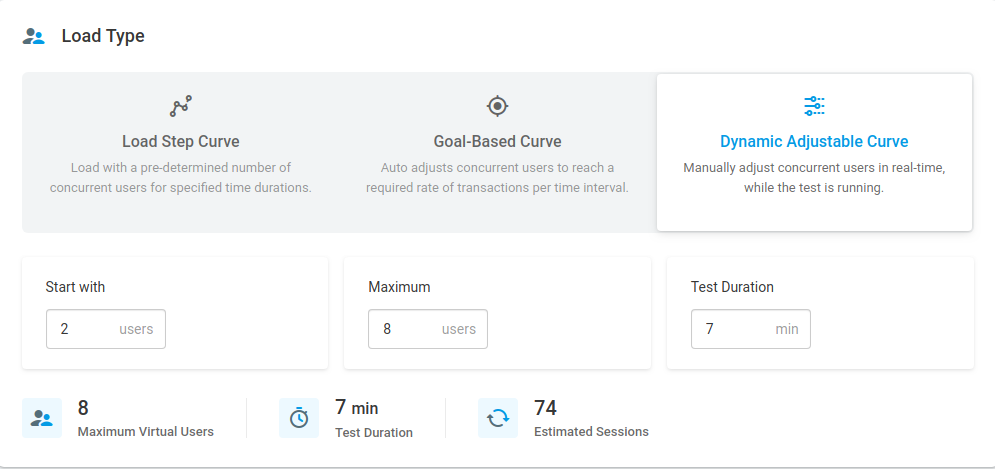
Dynamic Adjustable Curve
By setting a starting point and a maximum value, you can move between numbers of concurrent users while your test is executing. This is the same as drawing a graph using a freehand tool. Dynamic adjustable curve option even answers to the most complex use cases and load spikes that these states may incur.
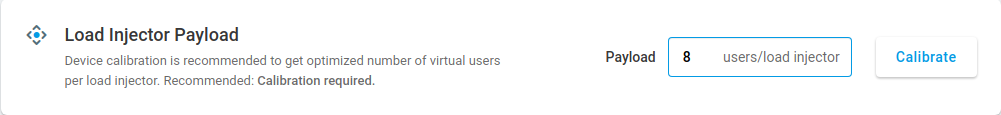
Load Injector Payload
This setting decides the number of users per load injector. The recommended number can be set using the calibrate button.
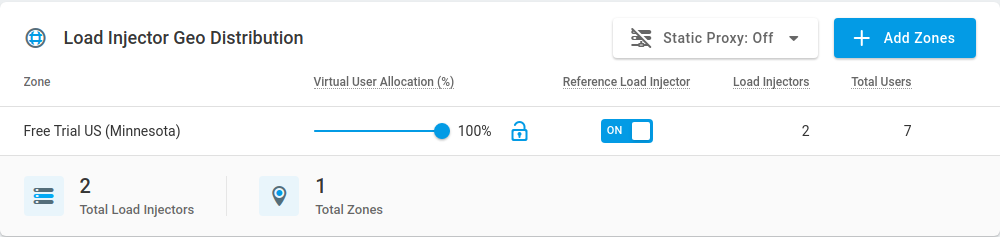
Load Injector Geo Distribution
Different geo-locations can be set for different load injectors. This helps to test your system using different requests from various locations. The LoadView platform allows you to choose from over 15 worldwide locations.
Understanding Performance Testing Results
From the reports section, extra graphical information about the load testing can be found.
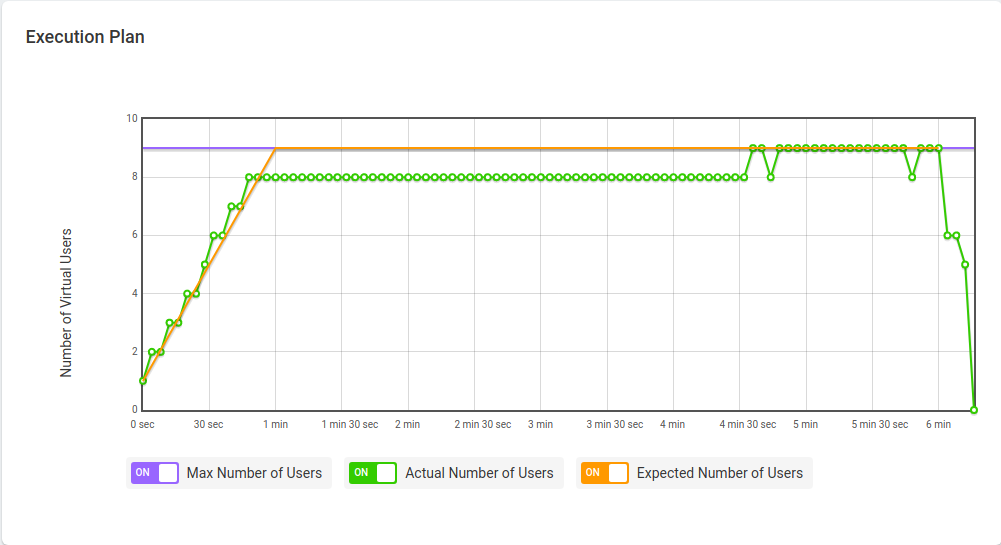
In the execution plan graph, you can investigate whether the load test was executed as expected or not. For instance, in the graph above, after the 30 second – 1 minute mark, we can see that the actual number of users could not hit nine users for some reason. The maximum number of users was achieved after the 4 minute, 30 seconds mark.
Execution Plan
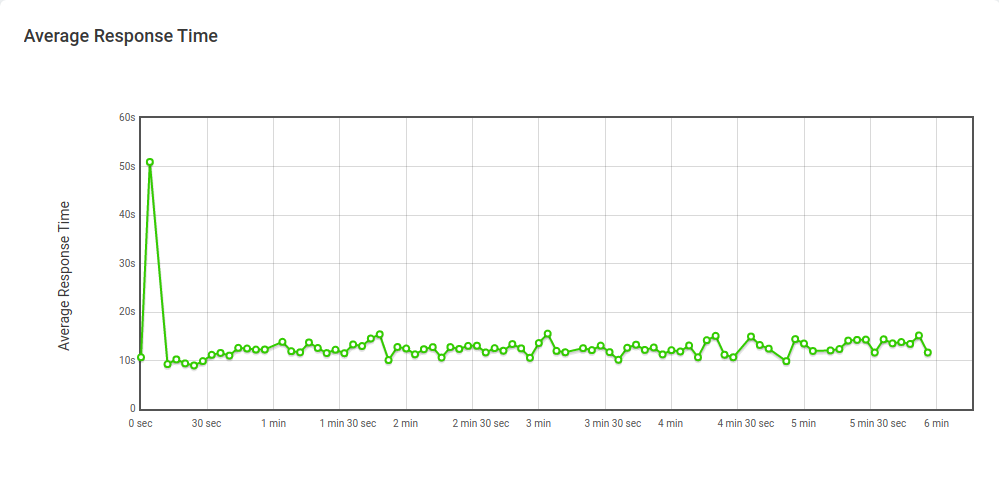
The average response time graph is great for understanding how your system behaves under different loads. In this test, we can see that the tested system’s response time increased dramatically on 0-30 sec mark. ( ~50 seconds, indicates a bottleneck) After the first peak average response time was around 10 seconds, which is pretty slow for user expectations today (all websites should aim under 2 seconds for the minimum bounce rate and maximum conversion rate).
Average Response Time
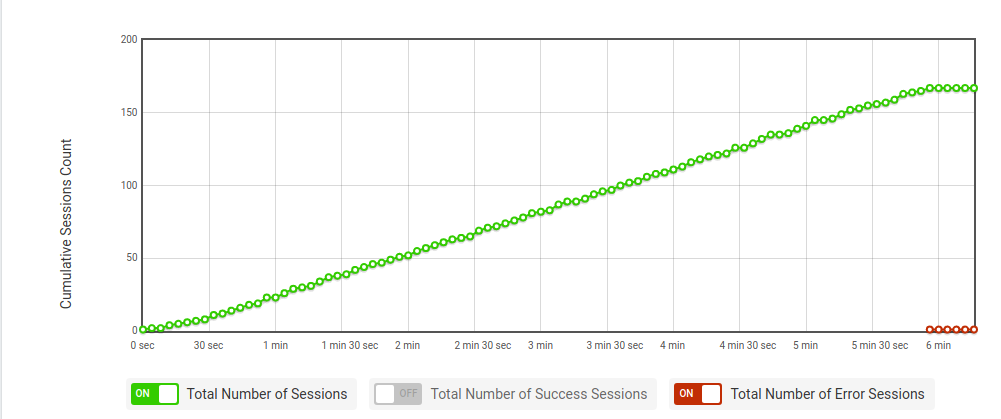
Cumulative Session Count
Cumulative session count throughout the load testing course. From the graph above, the total number of sessions the system can handle be deducted. In this instance, after 150-200 sessions, some new sessions couldn’t start and threw an error.
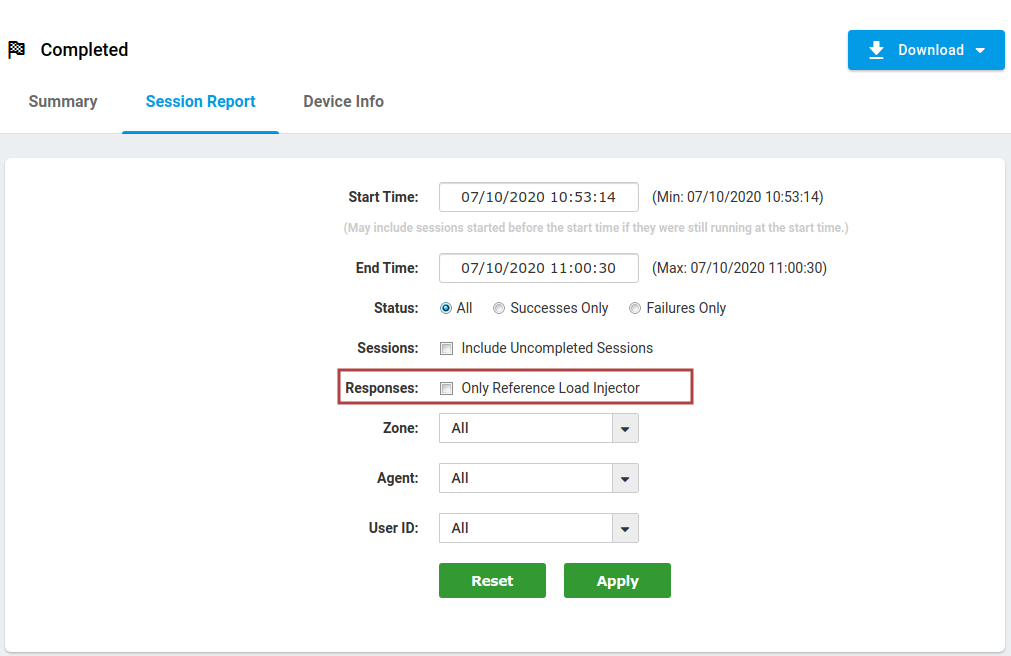
Reference Server
From the Session Report tab, you can filter out the sessions to only include the reference load injector. This reference load injector excludes the hardware stress (it runs only one virtual user) during the test execution so that you can compare it with the heavily loaded versions.
After filtering the reference load injector sessions, you can playback the execution video to compare the load injectors and the reference user using the video button.
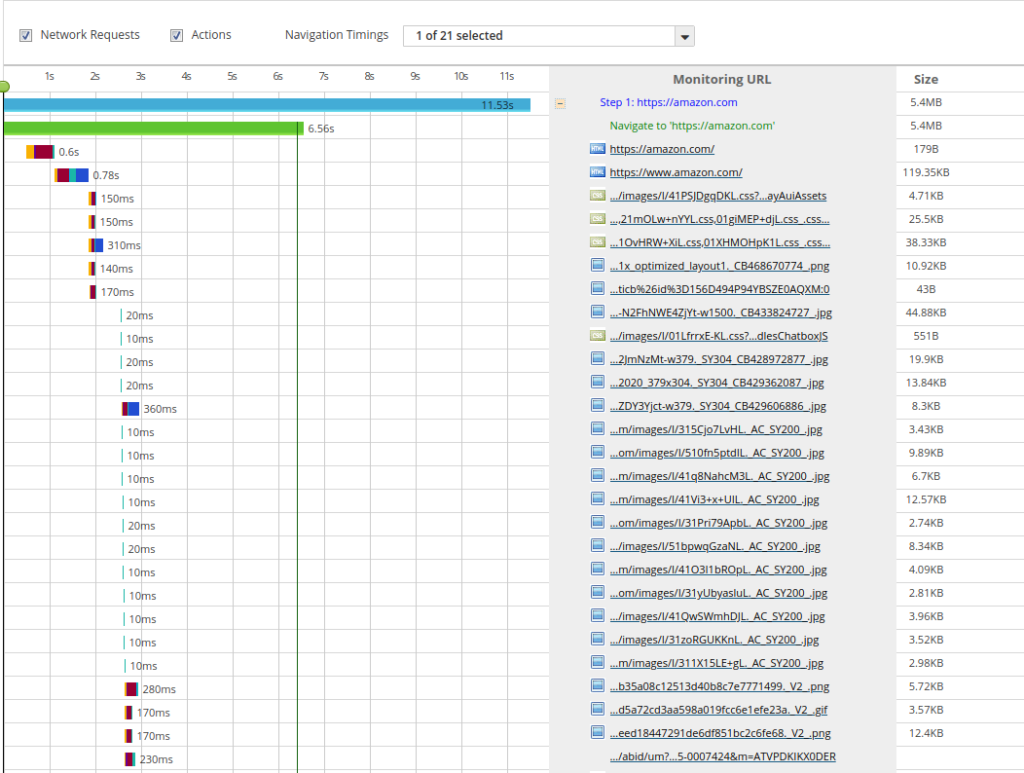
Waterfall Charts
Finally, waterfall charts give in-depth knowledge about your web interface and bottlenecks. For example, a website consists of file requests made to the web server (CSS files, JavaScript files, HTML files, etc.). Using the waterfall chart, we can understand which request is the blocking factor, increasing the load speed. Eliminating the blocking element, making the requests asynchronous or only loading the critical CSS first, and then the rest of the CSS after can decrease the load time.
Understanding these blocking factors in the early stage of development or launch can save a significant amount of budget and time, resulting in better traffic and capacity management. For more in-depth information about waterfall charts, read our blog article about optimizing web performance by understanding waterfall charts.
Conclusion: Load Testing Overview and Understanding Reports & Waterfall Charts
If your website or application is subject to a service level agreement (SLA), load testing becomes a must to show your clients that the software is ready for the expected amount of load. For example, if you already have a predetermined transaction goal, or know (approximately) the number of visitors you expect on your website or application during a specific time period, running a goal-based curve test will help confirm your site or application meets the pre-defined requirements.
Furthermore, generating increased load on a websites or applications can help predict application performance for heavier user load in the future. This is typically done for capacity planning purposes. The results of your load tests can help you determine the individual elements that need immediate attention. Additionally, LoadView keeps your previous test results so that they can be be used as benchmarks against new performance metrics after making changes to your site or application.
Try LoadView today! Sign up and receive up to 5 load tests for free!