Given the scale applications achieve, with up to millions of active users at a given moment, how is it possible these APIs remain performative and don’t crash? How do major organizations approach this mission-critical technical challenge? The answer is API performance testing.
API performance testing is a vast field. This brief article will help you understand the what, why, and how of API performance testing and familiarize you with essential jargon.
What Is API Performance Testing?
API performance testing is a huge umbrella with many different API testing subsets. Broadly speaking there are two main types of API testing:
Functional Tests
Functional tests verify the functioning of the API. For example, a test might serve to ensure the API returns the desired output for a given input. These tests are usually performed during the development of an API or after the discovery of a bug.
Non-Functional Performance Tests
Performance testing is a type of Non-Functional API testing. These tests are done after the development of the API and the goal is to test the API with virtual “real world scenarios.” Let’s take a deeper look at some common types of API Performance testing.
Load Testing
In Load Testing, a client-server system between the API (server) and User (client) simulates multiple users hitting the API at the same time. These virtually created users (VU) are the “Load” in Load Testing.
Load Testing answers questions such as:
- How will a given number of website users affect website performance?
- How many simultaneous users can a website or application handle?
- Where are the bottlenecks in my web application?
- What is the breaking point for my website?
- When will the system run out of resources?
Some other types of Performance Testing are:
- Spike testing. Spike testing subjects a software application to sudden increases in user load.
- Endurance testing. This tests how a software application responds to increased, prolonged levels of user traffic.
- Volume testing. Volume testing, also sometimes referred to as flood testing, tests a software application against large sets of data to see how it responds.
- Scalability testing. Scalability testing provides a way to view how your application or system scales up and/or down to various levels of users.
That was a brief look at “What.” Now let’s look at “Why.”
Why You Must Do API Performance Testing: Case Studies & Resources
As your online business grows, the user base grows too. An API is much more likely to crash at some point if there is not regular monitoring and maintenance.
A famous case study Feb 2020 UK Heathrow Disruption is a solid example of why load testing of software is essential. You can also review this article to learn more about the importance of load testing in software development and refer to this article to understand the economic benefits of Performance Testing APIs.
Simply put, API performance testing helps you prevent downtime, with all the corresponding problems that causes. Now let’s talk about the “how” of API Performance Testing.
How to Do API Performance Testing with LoadView Testing by Dotcom-Monitor
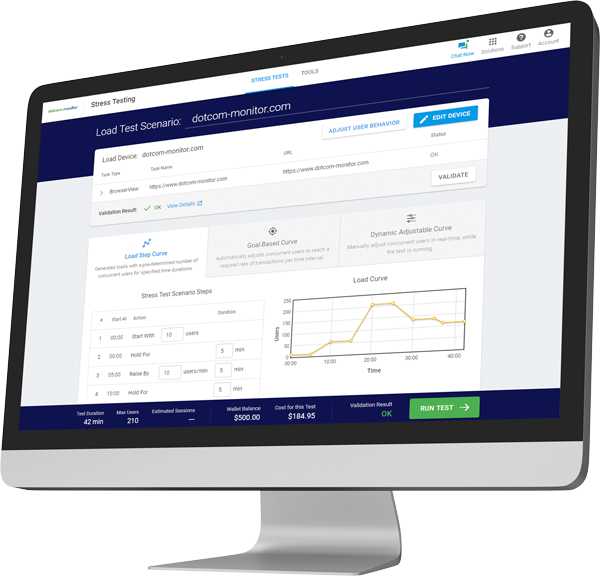
Our LoadView platform offers various on-demand solutions for a variety of tests of Web APIs, Web Pages, and Web Applications implemented and executed within minutes through a user-friendly dashboard.
At LoadView we provide hassle-free, Cloud-Based load testing in real browsers, which means no external applications or Libraries/Frameworks are required. LoadView Testing makes API performance testing simple. Here’s how.
How LoadView Works
LoadView uses a global network of Load Injector Servers (LIs) to generate user loads to test website performance. LoadView provides functionality to create and load tests against various targets. A few of the load testing types LoadView provides are:
- HTTP/S
Test the URL for accessibility, performance, correct content, errors, broken links, and more. - Website
Simulate concurrent users loading an online page. Choose from Chrome, Microsoft Edge, and Firefox and mobile browsers such as iOS, Android, Windows, and BlackBerry. - Web applications
Create test scripts with EveryStep Web Recorder to check web applications against concurrent users performing specific actions on real computers (Chrome and Edge) and mobile devices. - Streaming media
Test the performance and availability of your audio and media streams. - SOAP Web API
Check the performance, uptime, and responses of SOAP web services. - REST Web API
Check response content, uptime, and performance of REST web services. - Collections of Postmen
Test web APIs by importing Postman Collections into LoadView. - Selenium
Test web applications by running your Selenium test project with thousands of concurrent users from various locations around the world.
LoadView Load Testing Configurations
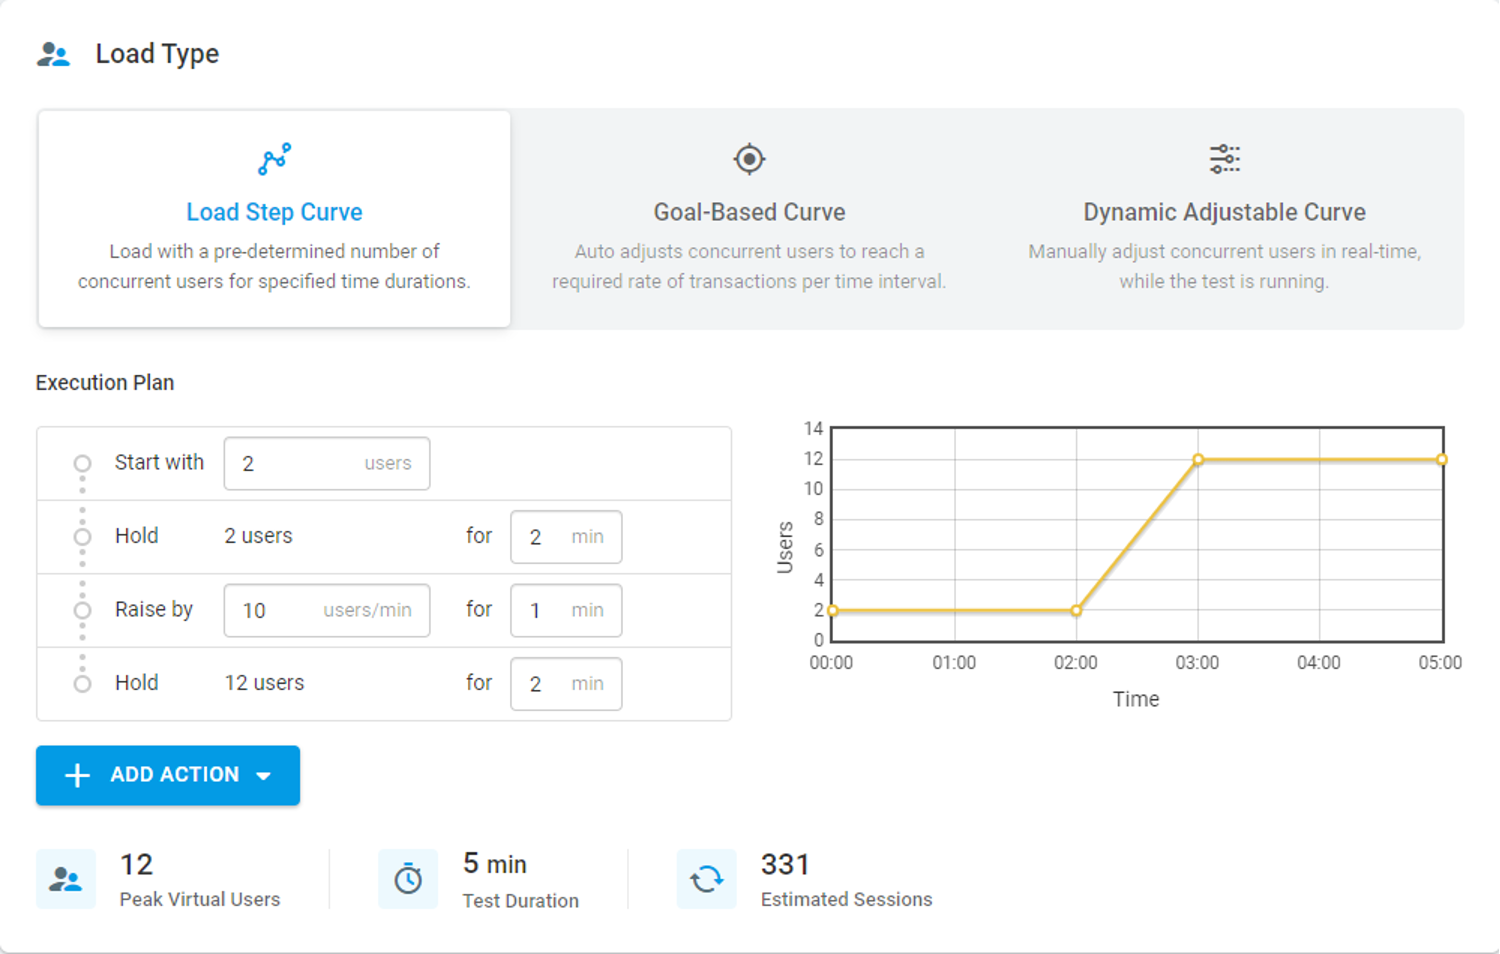
Load Type
With LoadView you can choose Load Step Curve, Goal-based Curve, or Dynamic Adjustable Curve. These load curve options allow you to regulate the volume of concurrent users to match real-world scenarios and supply more realistic test results.
Test Duration
Test duration and testing limits determine the concurrent number of user sessions and duration of the test. Read our LoadView Capacity Limits documentation for more information on testing limits.
User Behaviors
To simulate how real visitors move across your website, user behaviors are used. You can select between regular, maximum, or custom choices. When the Normal user simulation option is used, random delays in the range of three to six seconds are added to simulate how normal users behave. The test is done as rapidly as feasible when you select “maximum.” You can use this feature to run stress tests on your system and determine where and when it reaches maximum capacity.
The “custom” option gives you the same ability to select random delays as the Normal option but allows for shorter and longer delays, ranging from zero to 30 seconds, for greater personalization.
Geographic Locations
To mimic more realistic user situations based on where people typically access your website, you can choose from a variety of geographic zones and divide virtual users between zones with LoadView. Choose from more than twenty places at a time.
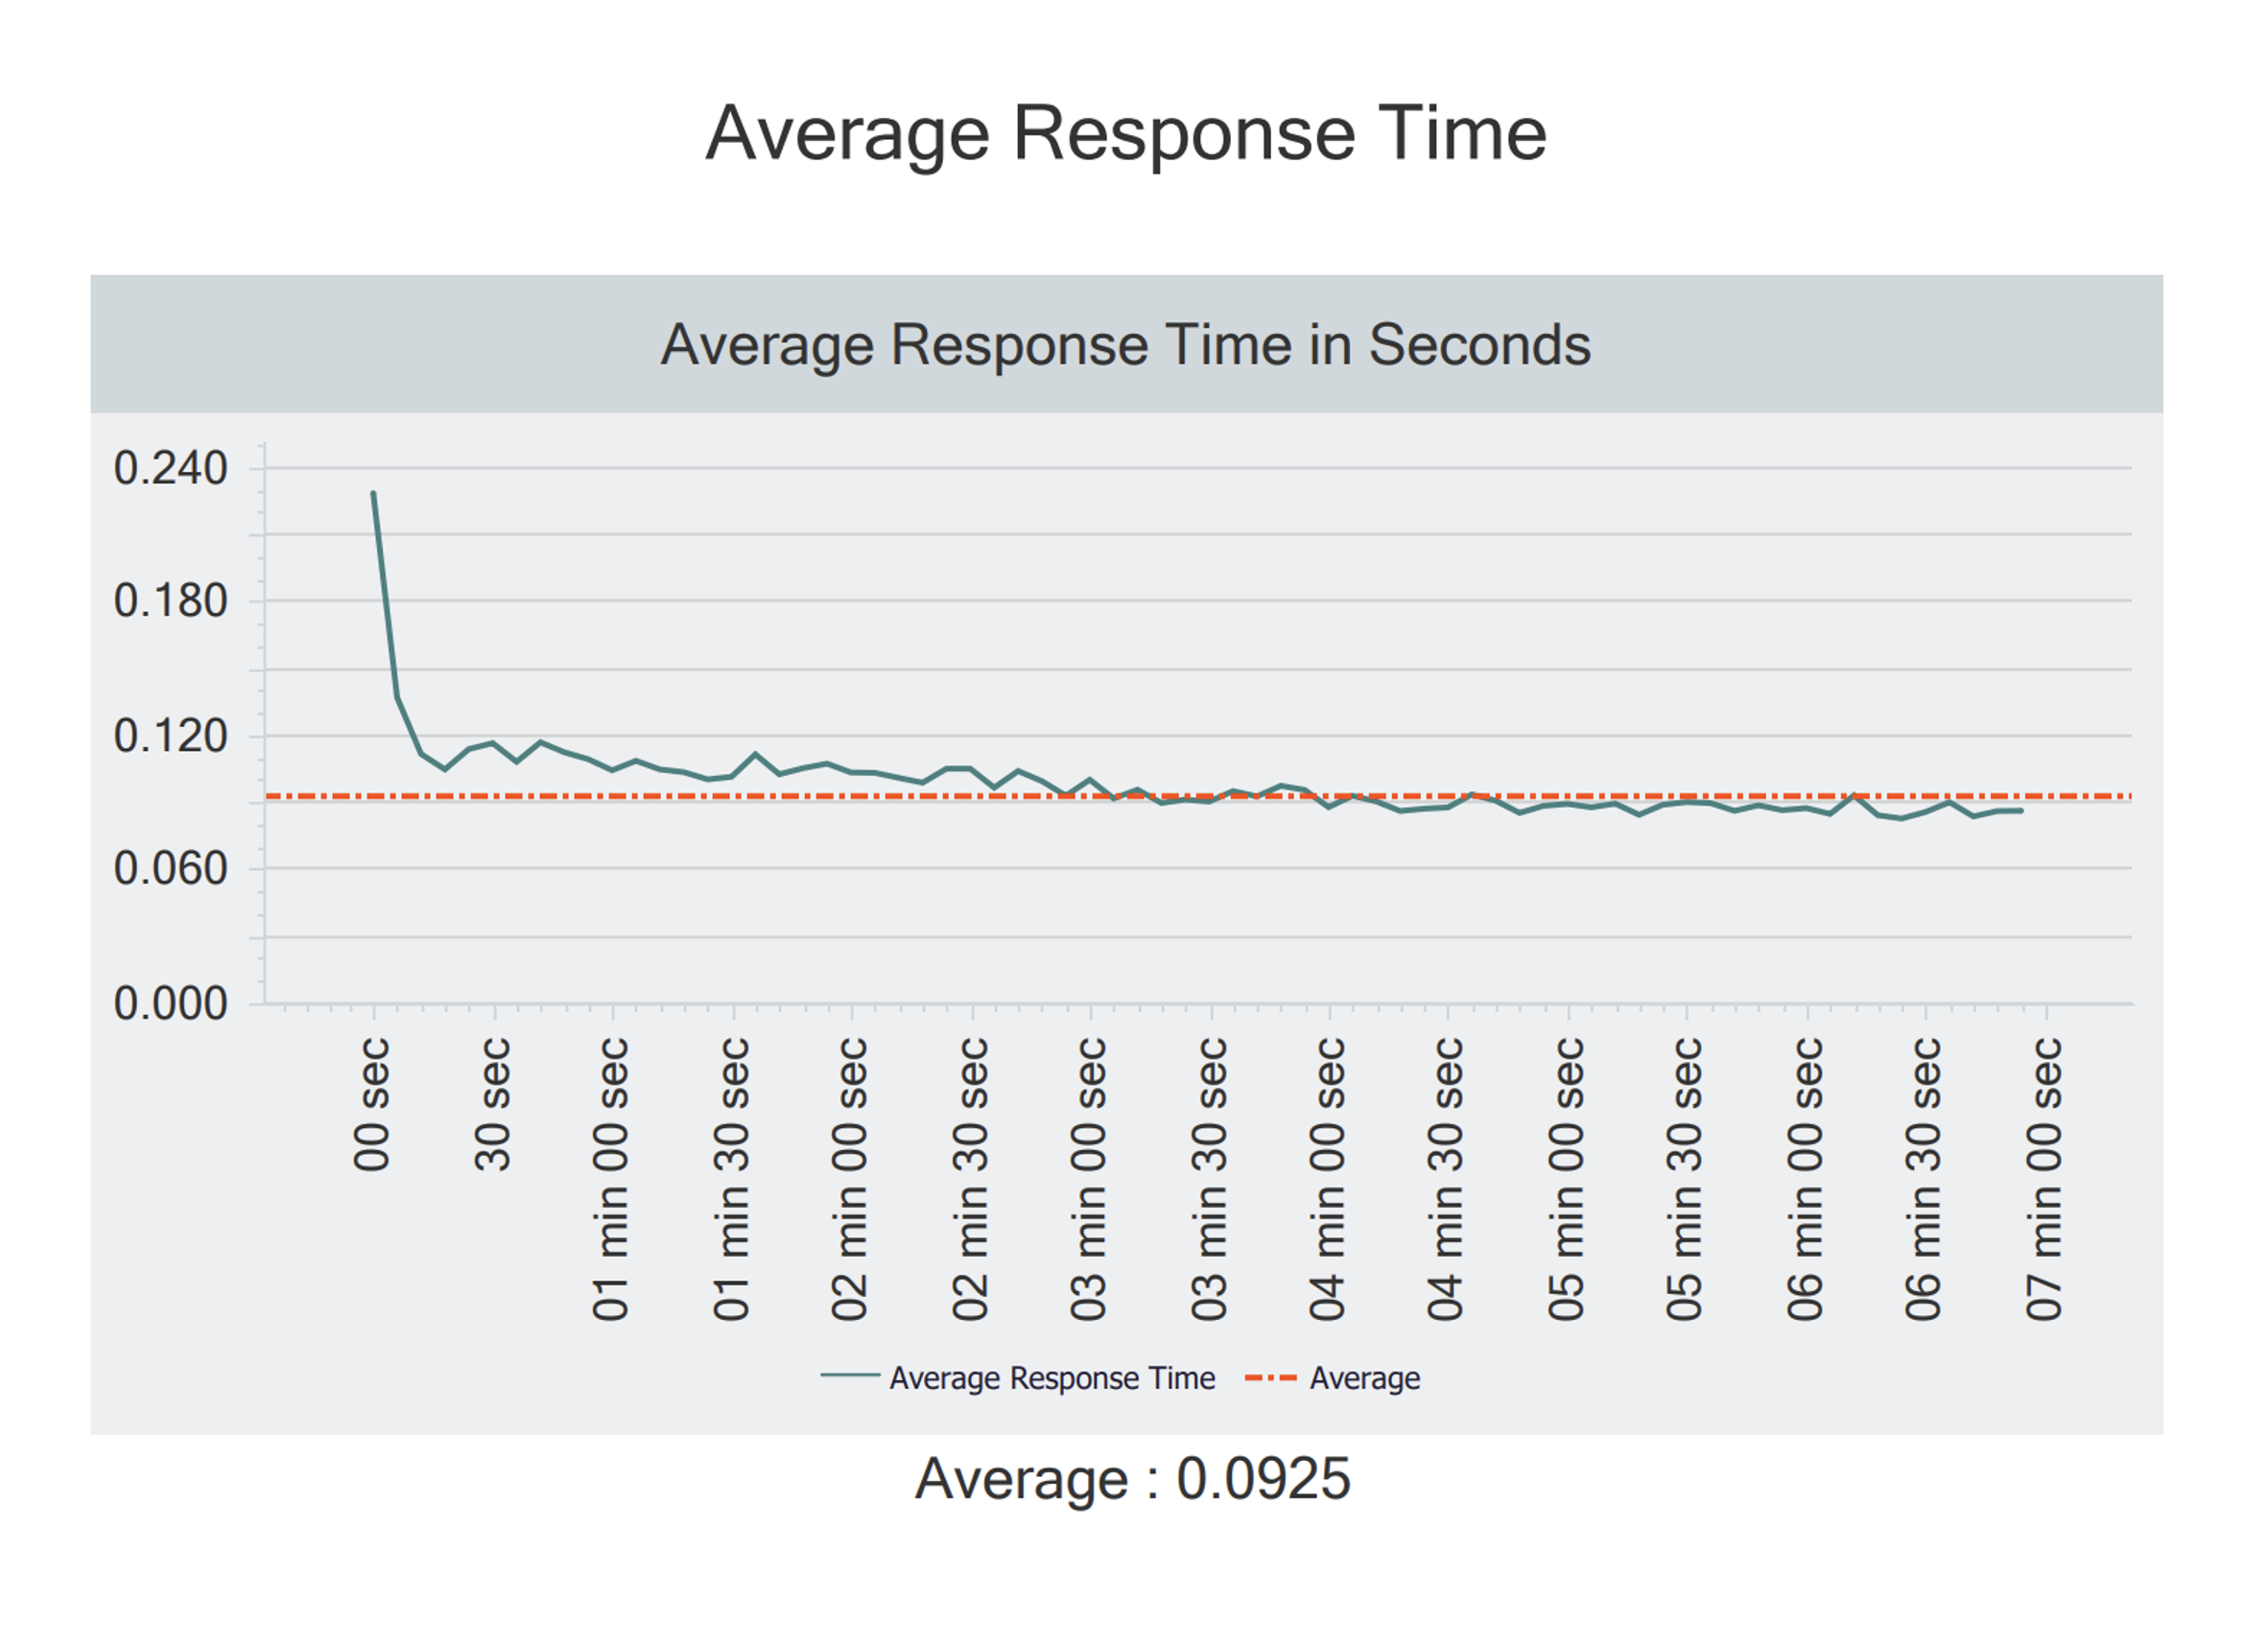
Test Summary
Test administrators can look at graphs that demonstrate how response times changed as the load and user count varied. The test execution plan, average response times, number of sessions, number of errors by type, and CPU consumption by each of the load injectors are some of the charts you’ll be able to review.
Errors are also shown here, together with information about the sort of problem encountered and when it happened during the test. Raw data from a given test may be downloaded as CSV files, which you can use to build custom reports or presentations for stakeholders and team members.
If you haven’t already, you can start your free trial of the LoadView platform here. And if you’d like a one-on-one demo, book a time with one of our performance engineers. We’ll be glad to hear from you.