Auto-scaling promised to eliminate the guesswork of capacity planning. Set your rules, define your metrics, and let the cloud handle the rest. At least, that’s how it looks on the slide decks. In practice, scaling rules rarely behave the way you expect. They lag, overreact, or stay asleep when traffic surges.
These failures aren’t dramatic outages—they’re quiet inefficiencies. Instances take too long to spin up. Cooldown periods suppress needed reactions. Costs spike from over-scaling, or latency creeps in when scale-out events fire too late. The only way to see this behavior is to force it into the open through deliberate, dynamic load testing.
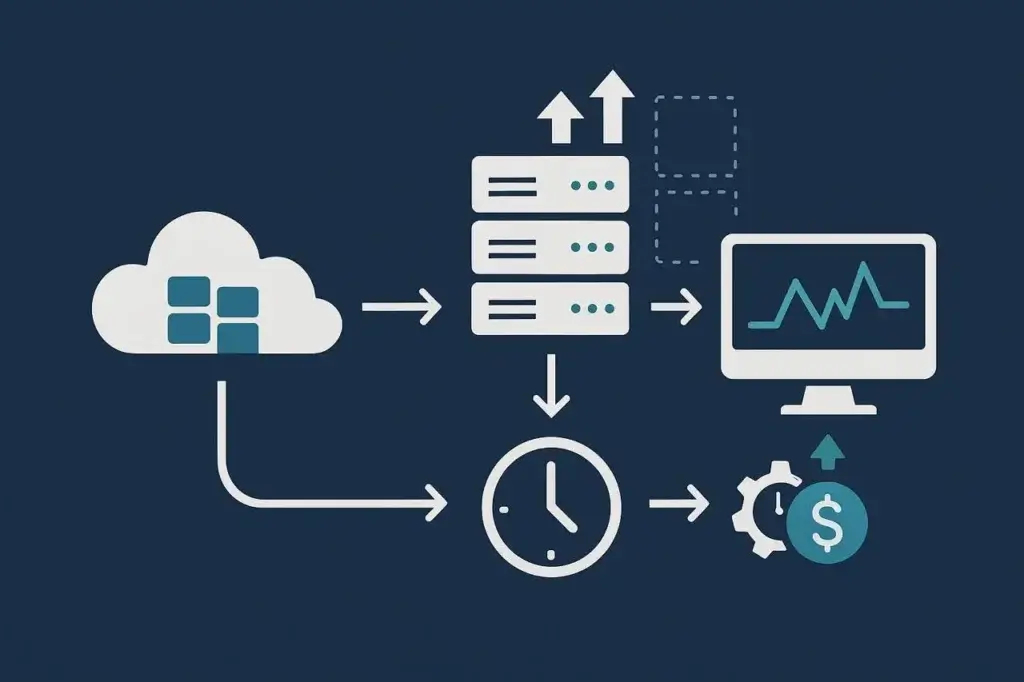
Auto-scaling isn’t automatic. It’s conditional automation—and those conditions only reveal themselves under load.
Why Auto-Scaling Rarely Works as Promised
Every scaling system is built on assumptions. The defaults—often tuned by cloud providers to minimize false triggers—rarely match real-world demand curves. CPU utilization thresholds might look safe in a dashboard but fail to represent true application stress. Memory pressure may not register until performance has already degraded. And scaling rules often rely on metric windows that are too long to respond in time.
For example, AWS CloudWatch collects and aggregates metrics in 60-second intervals. If traffic doubles within 20 seconds, scaling doesn’t even begin to consider reacting until a full minute later. Add another minute for instance startup and registration, and your “auto” system has already lost two minutes of user experience. Multiply that by 10,000 users and you’re watching elasticity lag behind reality.
This delay is the silent killer of perceived reliability. Applications don’t crash—they just slow down, drift out of SLA, and slowly lose trust. That’s why scaling failures are so hard to detect without explicit testing. Metrics show the system caught up eventually. What they don’t show is how many users you lost before it did.
The Hidden Dimensions of Cloud Scaling Rules
Scaling looks like a single dial in a console, but in reality it’s a complex matrix of triggers, metrics, and cooloffs. You can’t validate one without understanding how the others interact.
Consider the dimensions at play:
- Metric selection. CPU, memory, queue depth, and custom latency signals each tell a different story about system pressure. A CPU-based rule might miss a queue buildup, where a latency-based one might trigger too late.
- Aggregation and sampling. Metrics are averaged across time windows. A 60-second average smooths spikes that matter. Shorter windows are more responsive but noisier.
- Cooldown periods. To prevent thrashing, most systems enforce cooldowns before allowing another scaling event. The result is often an application that stays underprovisioned longer than anyone realizes.
- Warm-up time. New instances need bootstrapping—dependencies, caches, and connections. Scaling rules that assume instant readiness almost always overpromise.
Each of these dimensions can create a delay, oscillation, or overshoot that simple testing misses. A true load test maps these interactions by intentionally varying load speed, duration, and type. That’s when you start to see where scaling rules break their promises.
Designing Load Tests for Cloud Scaling Behavior
Traditional load tests aim to find breaking points. Scaling tests aim to find blind spots. The goal isn’t just to see if scaling occurs, but when, how fast, and at what cost. That requires designing your test scenarios around the timing and triggers that govern scaling.
Start with gradual load ramps. Increase virtual users or requests slowly over several minutes so the system crosses scaling thresholds in a realistic, measurable way. Abrupt spikes only confirm capacity limits—they don’t reveal rule behavior.
Next, add short, sharp bursts to see if cooldowns suppress scaling or cause lag. Sustained plateaus test stability after scale-out events. And once scaling occurs, you have to test the reverse direction: how quickly the system scales down when load subsides.
A complete scaling test usually includes four phases:
- Ramp up: Controlled load increase to trigger initial scaling events.
- Sustain: Hold steady traffic long enough to observe steady-state performance.
- Spike: Introduce rapid increases to reveal cooldown handling.
- Recovery: Drop load and watch how quickly resources contract.
Testing this sequence reveals how scaling behaves dynamically. A 2-minute lag might be acceptable for background services but fatal for transactional workloads. The point isn’t just to measure throughput—it’s to chart the cause-and-effect chain between load and response.
Modern platforms like LoadView make these patterns practical to simulate at browser level, triggering the same metrics your auto-scaling monitors rely on. That’s what turns theoretical elasticity into measurable performance.
Observing Lag in the Cloud: Metrics That Matter
Scaling lag isn’t always obvious until you know where to look. It lives in the space between thresholds crossed and resources provisioned, between instance creation and traffic stabilization.
The key is correlating multiple layers of data. Application performance metrics show symptoms. Infrastructure metrics show causes. The relationship between them defines your elasticity profile.
Critical measures include:
- Time from threshold breach to scale-out event.
- Time from instance creation to active load balancing.
- Latency change during that period.
- Stabilization time once new capacity joins the pool.
- Cost curve throughout the event cycle.
Plotting these metrics together exposes how scaling feels in production. You’ll often find that scale-out technically works, but the lag window still causes short-lived latency spikes or partial failures. Some teams even observe performance dips after scaling, caused by cold starts or connection storms as new instances come online.
A good scaling test visualizes this lag the way users experience it: not as metrics, but as time lost.
Dynamic and Adjustable Testing Loops
One load test tells you what happens once. Continuous testing tells you how scaling rules evolve as you tune them. The most effective teams treat scaling validation as a feedback loop.
After each test, analyze how quickly scaling responded and whether cooldown or metric windows introduced unnecessary latency. Adjust the rules—change the threshold, shorten or lengthen the window—and run the test again. Each iteration becomes a calibration step.
This approach mirrors performance tuning in CI/CD. You’re not verifying static correctness, you’re training the system to react with the right tempo. Over time, you can even automate it. Dynamic test pipelines can vary traffic patterns automatically based on prior results, nudging scaling rules toward optimal responsiveness.
That’s where elasticity stops being theoretical and becomes measurable engineering.
Common Failure Patterns in Cloud Scaling Rules
Scaling systems rarely fail spectacularly. They fail subtly, in patterns that only appear once you’ve watched them under pressure. A test run might look stable at first glance, but beneath the metrics you’ll see scaling rules fighting themselves—triggering too late, reacting too often, or responding to the wrong signals entirely. These aren’t random glitches, they’re repeatable design flaws that emerge from the way scaling logic interprets real-world traffic.
Load testing doesn’t just reveal these patterns—it gives them shape. Once you understand the shapes, you can design around them. Four of the most common look like this:
- Delayed triggers. Rules tied to slow-moving metrics (like averaged CPU or multi-minute latency windows) activate long after users feel the slowdown. The system scales eventually, but not soon enough to prevent degraded experience. Load testing exposes that gap clearly, letting teams shorten windows or switch to more immediate signals.
- Thrash cycles. Overly sensitive thresholds cause the system to scale up and down in rapid succession. Each oscillation wastes cost and destabilizes the workload. Testing with different ramp and cooldown patterns helps reveal the balance point between responsiveness and restraint.
- Metric mismatch. The rule tracks the wrong symptoms. CPU usage may look fine while the message queue or thread pool backlog climbs out of control. Load testing uncovers these hidden bottlenecks by correlating workload type to the metric that truly governs it.
- Provider lag. Cloud providers don’t operate in real time. In AWS, CloudWatch’s one-minute data granularity and asynchronous publishing mean scaling always trails demand by at least a minute. Testing helps teams calibrate expectations and offset that latency through predictive scaling or prewarming strategies.
Each of these failures leaves a signature—oscillating graphs, uneven latency curves, instance counts that look like sawteeth. Without testing, they stay buried under aggregate averages. With testing, they become actionable intelligence. That’s the real value of load testing in cloud scaling: not proving that the system grows under load, but discovering how it grows, when it reacts, and why it sometimes doesn’t. Only once you can see those fingerprints can you start engineering them out.
Engineering for Elastic Predictability
Elasticity isn’t just scaling up, it’s scaling up predictably. That means tuning scaling rules around the application’s behavior, not just its infrastructure metrics.
Start by linking scaling triggers to user-facing performance, like request latency or queue depth, rather than CPU or memory alone. Predictive or step-based scaling, where the system adds instances in defined increments before thresholds are hit, often stabilizes workloads better than reactive models.
Treat synthetic load tests as calibration, not audits. Run them quarterly or after major architectural changes. Each run should answer one question: does the system scale at the speed and precision you expect?
Document the response profile—how long it takes to scale, how long it takes to recover. These numbers become your elasticity SLA. Once you have that baseline, you can finally say your system scales “automatically”—because you’ve proven it, not because the console said so.
Conclusion
Auto-scaling isn’t broken, it’s actually just misunderstood. Most of its failures come from human assumptions, not cloud deficiencies. The defaults work only for default traffic. Real workloads have their own pulse—and the only way to tune scaling rules to that rhythm is through intentional, repeatable load testing.
Testing reveals what dashboards hide: the latency between need and response, the oscillations that waste cost, and the thresholds that never trigger when it matters. It turns scaling from a reactive setting into an engineered behavior.
Elastic infrastructure doesn’t happen by chance. It happens when you pressure-test the rules that govern it. With the right load testing approach, your scaling becomes less of a promise and more of a contract—with users, with budgets, and with reality itself.