Load testing vs. Stress Testing
Before we explain how to determine the application breaking point within the LoadView platform, we must first describe the differences between a load testing and a stress test. While the terms are often used interchangeably, these tests seek to find different results.
A load test is a type of non-functional testing used to validate the health of a system while under a specific level of simultaneous requests, also known as load. The goal of a load test is to prove that a system can handle an expected, or acceptable level of volume with minimal disruption or degradation. Factors that are used to create this performance baseline are connection speed, latency, and download times, among others. Generally, load testing is carried out to help predict application performance within realistic boundaries, helping to understand how performance is impacted during peak load events. Pushing the system beyond these thresholds may inadvertently cause your load test to become a stress test.
On the other hand, a stress test is designed to push a system past the point of degradation, sometimes to the point of a complete failure. Pushing a system past the point of degradation or failure allows engineers to see how the system handles recovering from this failure and whether or not changes in hardware capacity are necessary. Some of the factors that are typically monitored during a stress test are disk I/O, bandwidth, CPU usage, memory, and various database performance metrics.
Calculating Initial Load
Determining the breaking point of an application isn’t typically straightforward as it seems. Obviously, if the server crashes, you’ve definitely found that point, but there are other factors to consider, such as response times. These days, if a web page or application doesn’t respond within just a few seconds, users are going to bounce. Long response times can be an indication that your application is down. Another indication something is broken is that you begin receiving comments from users about web page issues or your support or IT team is notified through trouble tickets.
First, consider the number of your web servers in use and the number of CPU cores available. For this example, we’ll assume we’re working with a quad-core web server and we’ll use a starting point of 25 concurrent users per CPU core, so 100 concurrent users. However, it’s recommended to start with the number 50 percent lower than a calculated starting point, so that works out to 50 concurrent users. From this starting point, and depending on the application performance requirements, you can increase the load to 5x or 10x more.
Choosing a Load Curve: The LoadView Platform
The LoadView platform gives users the ability to choose from three different load curve options.
- Load Step Curve. The test type allows comparing response times under the operational load and under the expected traffic load.
- Goal-based Curve. This test is useful for when you already have a predetermined throughput (transaction goal), or the number of visitors you expect on your website during a fixed time interval and you want to make sure the site meets the requirements.
- Dynamic Adjustable Curve. You can use this type to find out the site performance limits or to plan its server capacity by changing the user traffic manually during the test.
For the purposes of this example, we’re looking to determine the breaking point of an application, and we’re not working with a predetermined throughput or transaction goal, so we won’t be considering the goal-based curve option. With the dynamic adjustable curve test, you can ramp up the traffic until you find the breaking point, or with the load step curve, you can set the ramp-up rates until you find that breaking point.
Another factor to take into consideration is the transaction run time. Once your stress test device has been created, this value can be found in the Performance report following the validation process. For example, if the transaction run time is around 30 seconds, you’ll want to hold the load for double that amount of time, ensuring the transaction finishes executing, even if the response time increases.
Finding the Application Breaking Point
Below are the results of a basic HTTP stress test, utilizing a load step curve, with a beginning load of 12 users per minute.
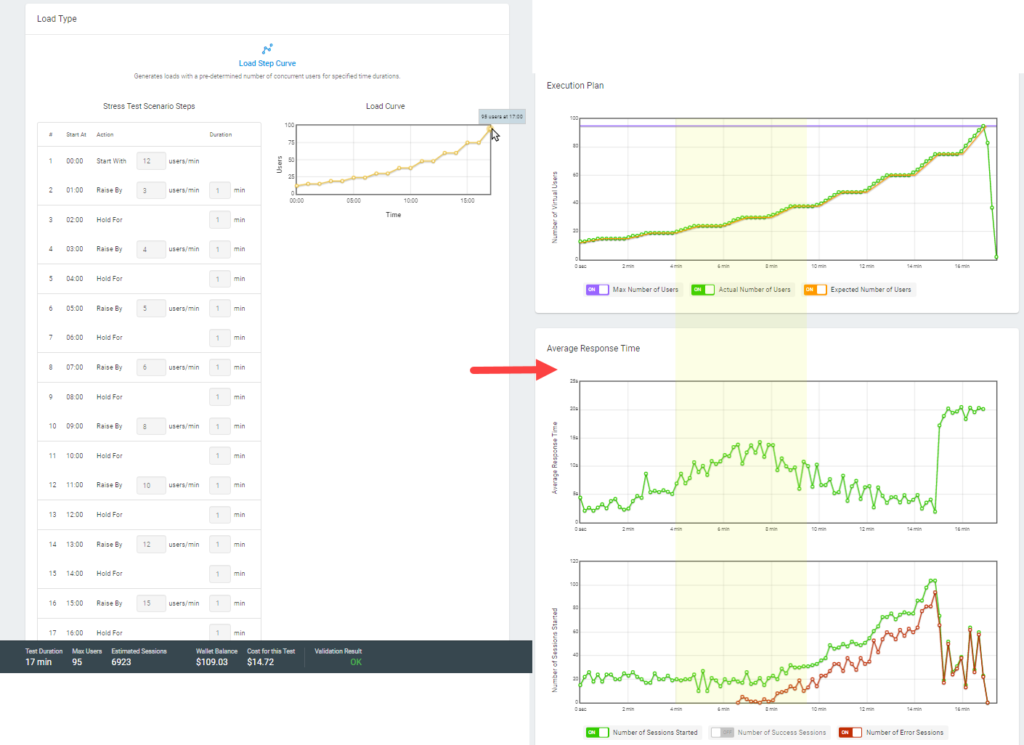
As you can see within the areas highlighted in yellow, there’s an increase in response times and number of errors as the number of users is raised over time. Depending the requirements of the application, at any point where errors occur, this could be considered the breaking point. Or instances where response time is of utmost importance, the application breaking point could be where the response time exceeds the pre-defined threshold.
For more information about executing stress tests within the LoadView platform, please visit our Knowledge Base.