Modern users expect blazing-fast application performance — and any delay, even in milliseconds, can lead to increased bounce rates, poor user experience, and lost revenue. That’s why real-browser performance testing tools like LoadView are vital for engineers, testers, and DevOps teams.
This guide demonstrates how LoadView’s:
- Response Time Graphs;
- Session Drill-Down;
- Waterfall Timing Views
help you identify, diagnose, and resolve complex performance issues across the full application stack — frontend, backend, and third-party services.
1. Response Time Graph – Visualizing Performance at a Glance
The Response Time Graph offers an immediate view of system behavior over time. The image below illustrates average and 90th percentile response times across key transactions using real browsers:
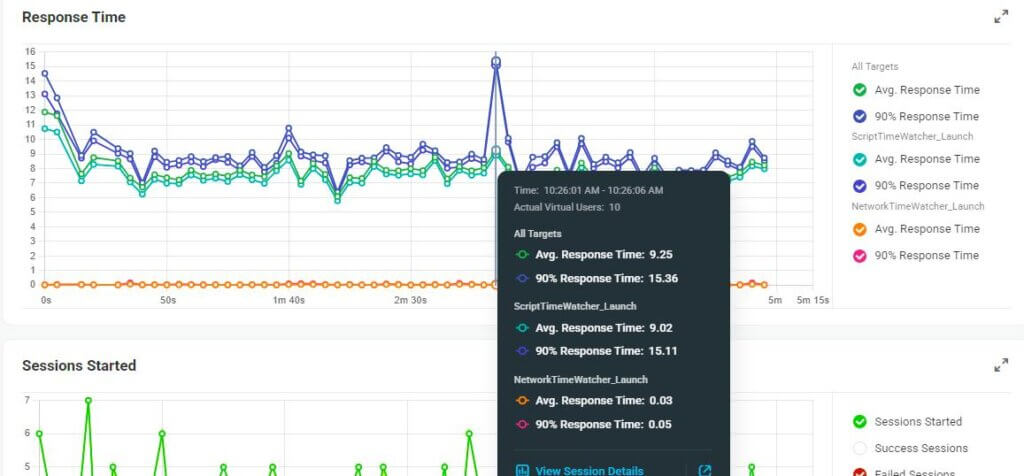
1.1. Key Interpretations
NetworkTimeWatcher_Launch:
- 90th Percentile spikes as high as ~15s.
- Indicative of occasional latency spikes, possibly from backend API delays, slow authentication, or resource bottlenecks.
- Consider optimizing thread pools, backend queries, and async loading.
ScriptTimeWatcher_Launch:
- Average response time trends between 7s–9s, showing stable but improvable load handling.
- 90th percentile remains higher, pointing to inconsistent load behavior under peak.
Other Transaction Types (orange & pink):
- Near-zero values indicate minimal execution time or lightweight operations (e.g., logout or stateless ping checks).
1.2. Use Case Examples from Graph Patterns
Here are common real-world patterns visible in response graphs, with likely root causes:
| Pattern | Likely Issue | Optimization Suggestion |
|---|---|---|
| Steady high avg. response | Heavy initial payload, poor asset caching | Gzip, image compression, DB query optimization |
| Spiky 90th percentile | Backend saturation or inconsistent DB access | Tune thread pool, profile slow queries |
| Gradual increase over time | Memory leaks or GC issues | Monitor heap, increase JVM tuning |
| High avg but flat 90th percentile | Shared bottleneck for all users | Backend profiling, architectural review |
| Very low logout time | Stateless logout or pre-cached flows | No action needed |
2. Session Drill-Down – Understanding Behavior Per User
LoadView’s Session Drill-Down allows detailed inspection of every individual session — including request duration, status, user ID, time, and location.
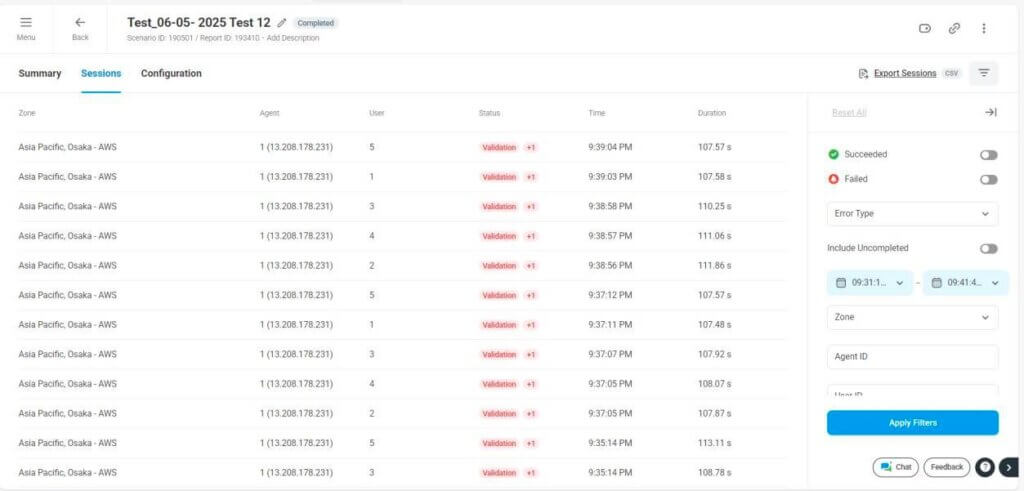
2.1. Insights:
- Multiple users across the same region (e.g., Asia Pacific – Osaka) encountered the same issue.
- Durations cluster around 110–113 seconds — indicates consistent backend or test logic problem.
- A functional error (e.g., missing field, server not responding) could be the root.
2.2. Key Scenarios Identified via Session Drill-Down
| Session Behavior | What It Indicates |
|---|---|
| All sessions fail validation | Functional bug or misconfigured test assertion |
| Some users spike in time | Local client issues or CDN delay |
| All users slow in one region | Regional backend saturation or weak CDN edge |
| Same user ID always fails | Corrupted data, login lockout, or cache issues |
3. Waterfall Timing – Millisecond-by-Millisecond Breakdown
LoadView records every step of every user session, providing a waterfall chart showing:
- DNS lookup
- TCP/SSL connection time
- First byte received (First Packet)
- Full download time
This helps dissect why a particular request took longer than expected.
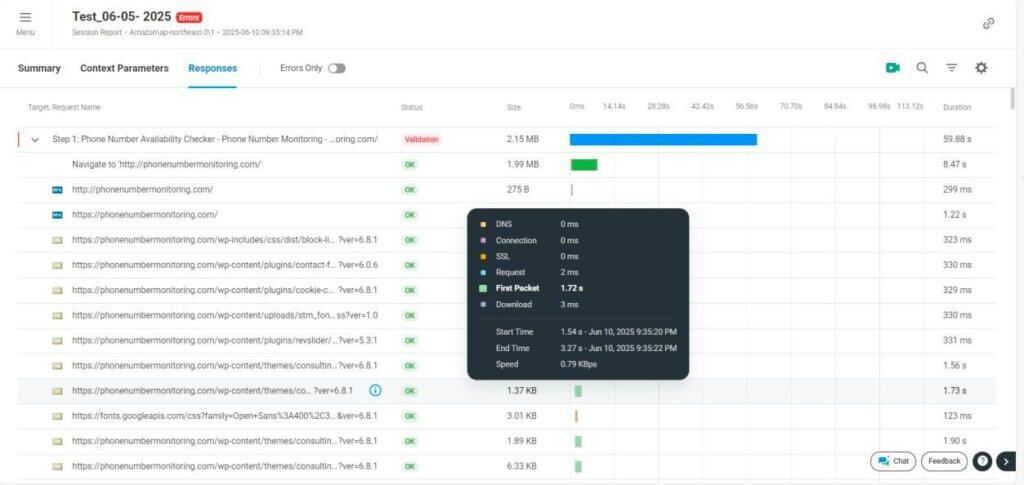
3.1. Insights:
- Backend processing issue — could be due to:
- Slow DB response
- API dependency lag
- Server overload (CPU/Memory)
- All other assets (CSS, JS, Fonts) load in <3 seconds — frontend not at fault.
3.2. Additional Bottleneck Examples
| Waterfall Symptom | Likely Cause | Fix |
|---|---|---|
| First Packet > 1s | Backend response delay | Optimize API, DB indexing |
| DNS > 300ms | Bad DNS config or routing | Use Anycast DNS or Cloudflare |
| SSL > 1s | Poor TLS negotiation or misconfigured cert | Enable HTTP/2, fix cert chain |
| Download > 5s | Uncompressed or large files | Use compression, image optimization |
| External call > 10s | Third-party API timeout | Implement retry logic, async loading |
4. Repeating Patterns in Load Testing? Look for These:
| Symptom | Source | Action |
|---|---|---|
| Launch always slow | Large initial HTML, rendering blocking JS | Lazy load content, minify JS |
| Login fails only under load | Authentication service scaling issue | Add more auth instances, cache token |
| Logout fast but Login slow | Login hits DB or auth layers; Logout doesn’t | Profile login backend path |
| Slow only from specific region | CDN routing or edge latency | Tune CDN settings, add origin servers |
| Runtime errors on certain domains | Missing CORS or CSP config | Fix headers or remove blocked resources |
Summary – From Metrics to Action with LoadView
LoadView doesn’t just run performance tests — it delivers diagnostic precision. By combining:
- Real-browser response graphs
- Session drill-down details
- Network and rendering step-level timing
you get a complete 360-degree view of your application’s real-world behavior.
Final Takeaways:
- Real users see every millisecond — LoadView helps you measure it.
- Use response graphs to identify when slowness occurs.
- Use session drill-downs to discover who is affected and how.
- Use waterfall timing to analyze why it happened.
- Use the insights to optimize backend, frontend, network, and external integrations.