When measuring website performance, understanding concurrent users is pretty important for an accurate analysis. It can be sometimes confusing to understand how concurrent users work and there’s a pretty big misconception when people look at the numbers of their concurrent users. Whether you’re optimizing for user experience or preparing for a big event like a product launch or sale, knowing how many users can access your site at the same time helps you gauge the performance under load. But what happens when you look at concurrent user metrics in different tools like LoadView and Google Analytics? Why do the numbers differ, and how can you interpret them accurately for better performance analysis? In this article, we’ll explore the difference between how LoadView and Google Analytics track concurrent users. We’ll break down session-based tracking in Google Analytics versus real-user simulation in LoadView, and show you how these metrics can impact your performance testing.
What are Concurrent Users?
Before diving into the differences between LoadView and Google Analytics, it’s important to understand what concurrent users are. Concurrent users are the number of people who are interacting with your website at the same time. For example, if 100 people visit your site and all of them are on different pages at the same time, there are 100 concurrent users. Some may be browsing product pages, some may be reading blogs, some may be checking out, etc., but they are not necessarily carrying out these transactions at the exact same time. These would be considered concurrent users. In a performance testing context, this metric helps you understand how your site performs when multiple users try to access it simultaneously. It’s important because your site needs to handle this load without crashing or slowing down significantly.
Many people confuse concurrent users with simultaneous users. It’s pretty important to know the difference. Simultaneous users are all users who are completing the same step of a transaction or code at the same point in time. If you consider the previous example for concurrent users, you could have a bunch of your users using your site in different ways but when all your users begin carrying out the same activity at the same time, they go from being concurrent users to simultaneous users. While it may be rare to have all your users carrying out the same activity, it’s important for stress testing your website or application to see what the breaking point is. For this, it’s crucial to utilize a load testing tool like LoadView that helps simulate these users to test both how many concurrent users your site can handle and how many simultaneous users your critical functions can handle
LoadView vs. Google Analytics: How They Measure Concurrent Users
Google Analytics
Google Analytics is widely used to track traffic and user behavior on websites. It’s such a popular tool that provides insights into how users interact with your site which includes metrics like total users, sessions, pageviews, and session duration. However, Google Analytics tracks concurrent users differently from LoadView because it focuses on sessions.
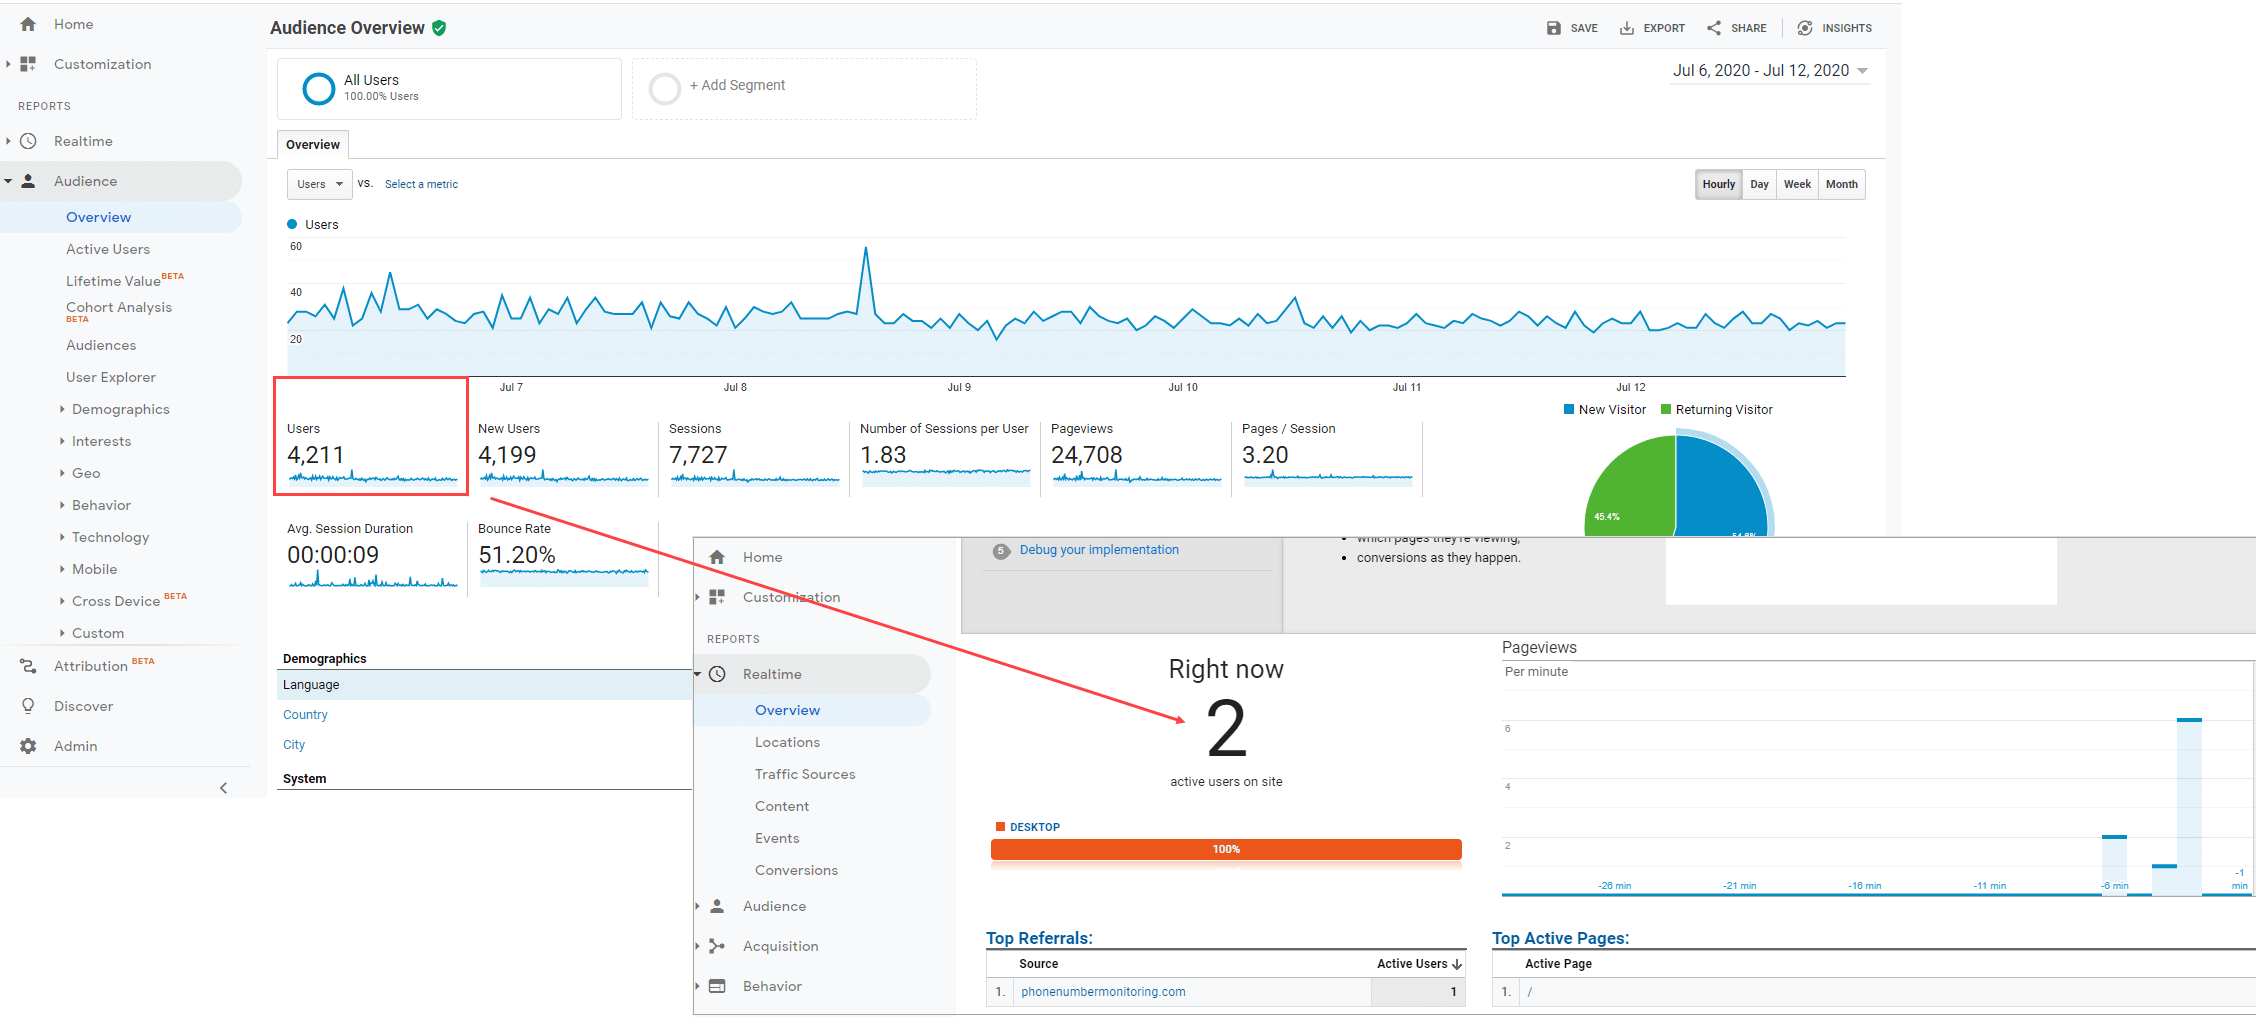
A session in Google Analytics refers to a group of user interactions with your website within a given time frame (typically 30 minutes). If a user leaves the website and returns within that time frame, it counts as the same session. The metric you’ll typically see in Google Analytics is Sessions per hour, which shows how many sessions occurred in a specific time period. For example, you might see hundreds of visits per hour in the analytic report for Google Analytics, but your site might only have two concurrent visitors at the same time. You can see this in the image below:
To calculate concurrent users from Google Analytics, you need to account for the number of sessions and the average session duration. Here’s how you can estimate the number of concurrent users based on Google Analytics data:
- Go to Google Analytics > Reporting > Audience > Overview > Hourly.
- Look at Hourly Sessions and Avg. Session Duration for the selected period.
- Use the following formula:
- Concurrent users = Hourly Sessions x Avg. Session Duration (in minutes) / 60
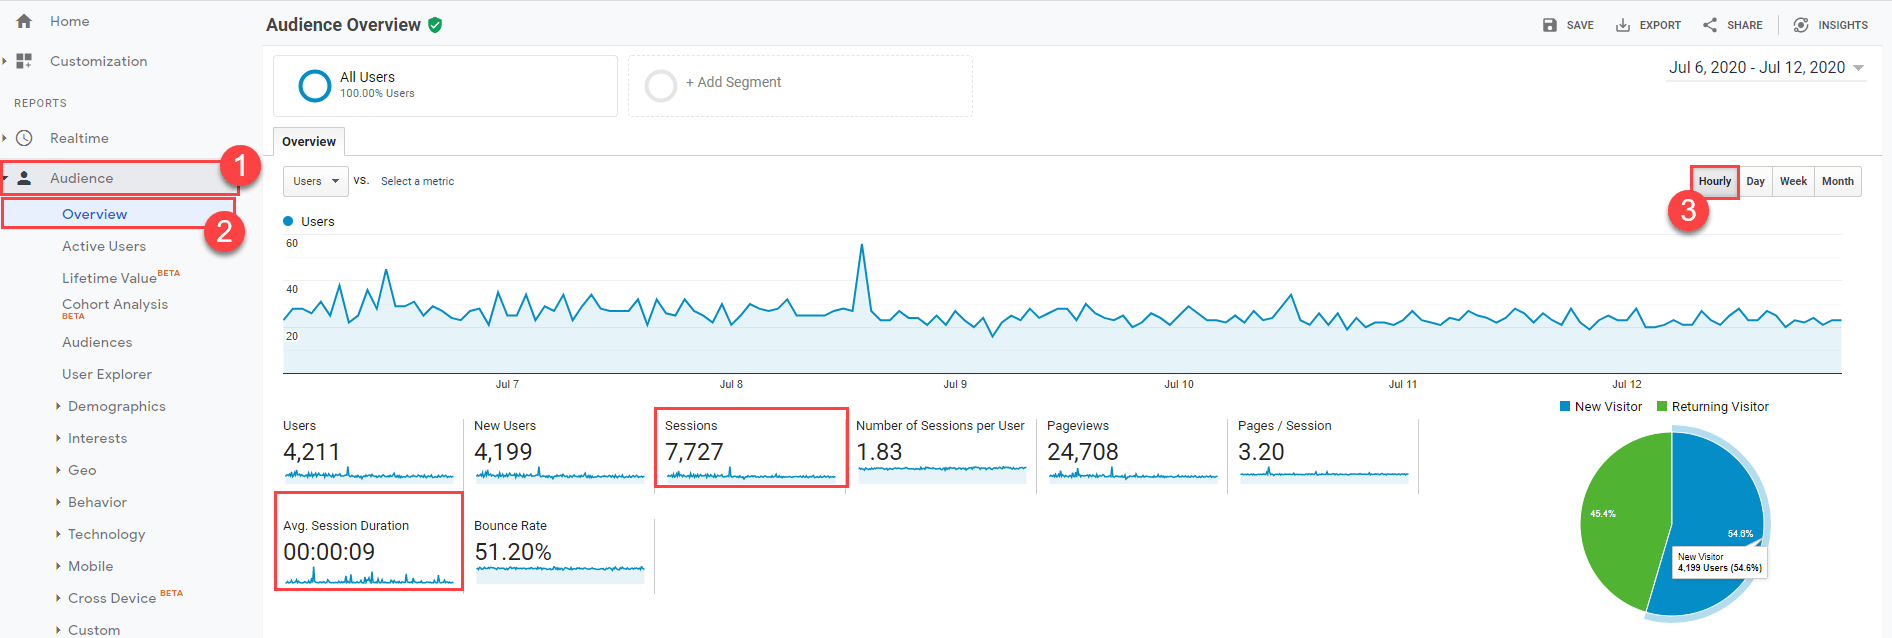
For example, if your website had 7,727 sessions in an hour and the average session duration was 9 seconds, the number of concurrent users would be:
Concurrent users = 7,727 x (9 sec / 60) / 60 = 19 concurrent users
While this formula gives a rough estimate, it doesn’t account for real-time user behavior such as whether your users are interacting with your site simultaneously which brings us to how LoadView tracks concurrent users.
LoadView: Real-User Simulation
LoadView, on the other hand, provides a more accurate picture of how your website performs under load by simulating real users. Instead of relying on session-based data, LoadView creates virtual users with their load balancers that mimic real visitors interacting with your website in real time.
This method of real-user simulation ensures that the concurrent users you simulate are actually performing actions like loading pages, clicking buttons, or submitting forms which is exactly what a real user would do. This helps to provide more reliable performance data for load testing, and this is especially important during peak traffic events when your website is under heavy use.
In LoadView, concurrent users are defined as the number of virtual users simultaneously accessing your site during a load test. This metric is more reflective of your site’s capacity to handle multiple users at the same time as it takes into account actual user interactions and not just the session data.
Why and How the Metrics Are Different
The main reason the concurrent user metrics differ between LoadView and Google Analytics comes down to the way each tool tracks users.
- Google Analytics tracks users based on session data which can lead to discrepancies because it doesn’t account for simultaneous activity. A single user visiting multiple pages might count as multiple sessions, but not necessarily as concurrent users.
- LoadView, on the other hand, simulates actual user activity and tracks concurrent users based on the number of simulated visitors interacting with the site at the same time. This provides a more accurate representation of how your website will perform under a specific load.
For example, while Google Analytics might show hundreds of visits per hour, the actual number of concurrent visitors interacting with your site at the same time could be far fewer. When using LoadView, you’re simulating those interactions so that you get a better idea of how your infrastructure will handle peak loads.
How to Use These Metrics for Better Performance Analysis and Actionable Insights
Now that you understand the difference in how concurrent users are measured, you might ask yourself, “how can you use this information for better performance analysis?”
You can use Google Analytics to gain insights into your website traffic. Google Analytics is great for understanding overall website traffic, user behavior, and patterns over time. It helps you identify peak traffic periods and general trends which is valuable when setting up load tests in LoadView.
You can also utilize tools like LoadView for realistic load testing. When you’re preparing for high-traffic events like Black Friday or a product launch, it’s important to simulate real users using LoadView. LoadView’s real-user simulation gives you an accurate picture of how your site will perform under pressure which allows you to identify potential bottlenecks, crashes, or slowdowns before they affect actual users.
We also recommend that you combine both to get a comprehensive view. This can be done by combining data from Google Analytics and LoadView so that you can plan better load tests and set realistic expectations for your site’s performance. Use Google Analytics to track user behavior and determine peak traffic times, then use LoadView to simulate concurrent users during those times to ensure your site can handle the load.
Wrapping Up
Getting a clear picture of concurrent users is a game-changer for performance analysis. While Google Analytics shines at giving you insights into traffic trends and user behavior, LoadView steps up by simulating real user actions to show exactly how your site handles the pressure. By understanding the difference between Google Analytics’ session-based tracking and LoadView’s real-user simulations, you’ll be able to understand more of these metrics and take smarter steps in optimizing your website’s performance.
Whether you’re relying on Google Analytics to watch traffic patterns or LoadView to prepare for high-traffic moments, using both tools is pretty key for keeping your site ready for anything that comes its way.
If you’d like to learn more about web analytics for concurrent users, check out our knowledge base article to get a better understanding on setting up your load tests.