How to Run a Website Speed Test
The Ultimate Guide
Your website is likely the single most important resource in your company. It’s the place where new visitors come to learn more about your product and service offerings, where current customers come back to purchase, and most importantly, where your money is made. And in today’s competitive landscape, it needs to be fast. Your potential customers have so many options at their fingertips. Within a few seconds, they will determine if they’re going to purchase from you or someone else.
For example, if you’re visiting a website and it doesn’t load, what do you do? That’s right. You probably close the window and go find the next best option. Let’s be honest, we’re all guilty of doing that daily, so just think if your website was slow and that was one of YOUR customers did. Not so great, right? We all know some of the consequences of a slow loading website – frustrated customers, visitor abandonment, negative perception of your brand, and most importantly, lost sales.
So, what can you do to ensure this doesn’t happen to you? Well, lucky for us, the Internet and search engines exist. If you just type in “test my website speed,” you’re bound to get more options than you know what to do with. However, as you’re reviewing potential website speed test tools, choose a website speed test tool that can test from the location(s) that your customers and visitors are from. The user experience, as experienced from the viewpoint of your users, will offer the best insight into actual performance. When you’re looking for a free website speed test tool, that means considering choosing one that can test from the same geographic regions where your user base is located, the browsers they use, and down to the specific devices they use.

Running a Website Speed Test
Everything You’ve Ever Wanted to Know
Running a website speed test may only take a few minutes, but the results you get from your test may end up giving you a tidal wave of information and more work than you expected. Consider for a moment the number of individual elements, JavaScript code, images, HTML, CSS, third-party elements, etc., that make up a single web page. Now consider the last time you tested your website speed. You may have added more pages, forms, videos, applications, etc., to your site and pages, but inadvertently forgot to test how that is now impacting your website’s performance for your users and visitors. Now picture having to run website speed tests for multiple pages, sites, and across different locations.
Makes it all seem a bit daunting, doesn’t it? But don’t worry. Whether you’re a web developer, web designer, or marketing professional, the tools and topics we cover here will give you the required insight into the various reports, metrics, and dashboards you need to focus on, so you can more effectively and efficiently optimize your web pages. This guide will cover all the topics, tools, and questions you need to know when running a website speed test, so when the time is right, you can feel confident that you’re ready to take on the challenge!
Website Speed Matters for SEO

Website speed is playing an even bigger factor in SEO, especially with Google’s rankings. And not just for traditional desktop websites and applications, but now for mobile devices as well. It was just a few years ago that Google implemented a mobile-first index. There are more than 3 billion mobile devices in the world, and that number is expected to climb as more developing areas become connected. So, as users shift from using desktop devices to mobile-first, developers and marketing teams need to put more effort into ensuring their websites perform fast on mobile devices. Again, the reason behind this is simple. If you’re website is optimized for mobile, when visitors find your website and it loads quickly, the more likely they will stay longer on your website and increase sales and conversions.
One important factor that plays a significant part of the user experience is network speed. Be aware that users are going to be using different networks speeds, 3G/4G/5G, and from different parts of the world, so knowing what devices/network speed your visitors and users utilize can give you major insight. Obviously, users with a 3G network are going to see slow load times, so as a benchmark, make sure your website is optimized to perform well, even with the slowest network conditions.
Faster Websites Are Better for Users
There’s a great article from the Nielsen Norman Group that found that despite the advances in Internet speed over the last 20 years, web page load time hasn’t really changed. And that’s across both desktop and mobile devices, but it’s worse for mobile devices, even with the increases in network speeds over the last decade. If your pages aren’t optimized, then the user’s focus moves away from your products, services, and content, to how slow your pages load.
One thing is clear. Users prefer a fast website and have no patience for waiting. If you’ve put in the work and optimized your pages for SEO, and a user clicks on your page and their first experience is watching your page load, you’ve probably already lost them. And even if they stay, their experience isn’t going to be great. If they’re judging their experience just solely on a page load, then any heavy resources you’re serving up on subsequent pages are probably going to take longer. There’s a tradeoff that organizations need to consider when trying to get your web page load times down to reasonable load speed. You might need to forego dynamic content, such as videos or images to reduce your web page load time. A delay of just one second is enough to break a visitor’s focus.
Improve Conversion Rates
If your website pages load faster, your users and visitors are more likely to stay committed and focused to the task they set out to do. For new visitors, that means educating themselves on the products and services they initially searched for. If they aren’t distracted or put off by slow loading web pages and content, they’re more likely to convert. If we look back at the Google benchmark report, they report that as the number of page elements, such as text, videos, and images increase from 400 to 6,000 elements, there’s a 95 percent drop in conversions. That just goes to show you how critical website speed is to visitors.
We mentioned it earlier, but with more people utilizing mobile devices, most of the web traffic generated today, and likely the trend moving forward, is from mobile devices, not desktop devices. However, the study also found that conversion rates with mobile devices are lower than desktops, so what does that mean for organizations? It means that their focus should be on two major factors: a mobile-first approach and speed. If you can optimize your top conversion pages, you will see likely see higher conversion rates. In the next section, we’ll talk about some of the improvements your team can implement.
Identify Areas of Improvement
Website speed tests can help you identify exactly what components, like images, JavaScript, CSS, and third-party elements are slowing your website down. An HTTP request is used to download all these elements, which ends up being a major factor in how fast your web page loads. The fewer HTTP requests, the faster your page will load. One important method and first step to reduce the number of HTTP request is to combine multiple scripts into a single script and combining CSS styles into one stylesheet.
Unlike web pages from the past, more of the responsibility for page load time has been pushed to the browsers, simply due to the dynamic nature of today’s applications and sites. However, it’s likely that most of your daily visitors will be coming to your site for the first time, which means there’s no data stored, or cached, in their browser. By combining files, you ensure that the experience for first time visitors is fast and uninterrupted. Also, ensuring your cache is optimized, for both static and dynamic content, can make a return visit faster, as these resources don’t have to be downloaded again. It’s just another method to ensuring a positive experience, even if visitors aren’t visually aware of the improvements you’ve made.

Positive Brand Perception
A great user experience can positively impact your bottom line. Conversely, a bad user experience can send visitors away and into the waiting arms of your competition. Even if you’re website is fast, optimized, and full of great content, doesn’t necessarily mean they’ll convert and become a paying customer. However, you can ensure that regardless if they do or not, they won’t be put off by slow loading pages and potentially share their negative user experience with all their friends, family, and co-workers. Word of mouth is still a powerful marketing/social tool for consumers, and more so in today’s digital world.
With all the options consumers have today at their fingertips, it’s still sometimes necessary for them to rely on close friends or contacts for advice or their experiences. Whether it’s to make sure they’re getting a good deal or trying to find a site that offers something they’re looking for, if someone mentions your brand, you want to make sure it’s in a positive light. The last thing you want them to talk about is how great your products and services are, but then they had issues searching for products because the images loaded slowly, or pages took a long time to load. Customers might be more hesitant to recommend your products and services to others, and that’s something that no company wants to hear.
No credit card, no contract.
How to PROPERLY Perform a Website Speed Test
If you’re an experienced web developer, you’re probably already well-versed in the ways of website performance tools. You’re probably aware of the tools in the market, or probably use a combination of tools to assist you in your website performance efforts. But if you’re just starting out, where do you begin? A quick search will give you plenty of options to consider, like website speed test tools from Dotcom-Tools by Dotcom-Monitor, Pingdom, GTMetrix, Uptrends, Webpagetest, KeyCDN, Cloudinary, among many others. Each website speed test tool offers varying functionality and features, so it can be a bit overwhelming at first, but we’ll cover how to properly perform a website speed test and cover the different features of some of the more popular website speed test tools in the market.
When performing a website speed test, it’s important to understand what metrics you’ll be looking for after running your test. Like we mentioned earlier, a fast website is crucial for SEO purposes, but there are other factors at play that affect performance that your everyday user wouldn’t be aware of.

From an SEO perspective, metrics like First Contentful Paint (FCP), First Meaningful Paint (FMP), and Time to Interactive (TTI) are all on-page browser metrics that need to be considered when ensuring your website, from the perspective of the user, is lightning fast. Remember, when visitors first land on your pages, they don’t want to be confronted with having to watch your page load. They want to start using your website as soon as possible and looking for the content and information they set out to find during their search. Every second is critical here. If any of these metrics are slow, it’ll likely give them time to consider finding an alternative, and faster loading site, to get their information. It’s possible their own network conditions are what’s making your web pages load slowly, but from a strictly visual/user experience perspective, these are important metrics to dig into first to improve website speed performance.
For example, the website speed test from Dotcom-Tools by Dotcom-Monitor offers insight into SEO performance by providing a Lighthouse report, along with a detailed waterfall chart (which we will get into later). The Lighthouse report offers critical insight into the factors and metrics of website speed and performance, accessibility, web page SEO optimization, along with suggested best practices. The website speed tools from Pingdom, GMetrix, Webpagetest, KeyCDN, and Cloudinary do not currently offer this feature. When choosing a website speed test tool, it’s important to choose one that includes this report as it gives you some great SEO benchmark metrics to start optimizing.
Waterfall Charts are another important resource to utilize when running website speed tests. The data from these visualizations and charts gives you an in-depth view into all the various components and elements. Waterfall charts show how the various website resources are loading, along with the timeline of those events, during page load. The visual representation allows you to easily see which resources are taking the most time, or taking the least amount of time, along with any detected errors, so you can improve those elements that are slowing your website load time or simply broken. The data from waterfall charts aren’t something the average visitor would be aware of from a visual perspective, but making improvements to any slow loading elements, third-party components, and errors, along with insights from Lighthouse reports, can dramatically improve overall website page speed and performance.
Waterfall charts can be overwhelming to look at initially, as they provide a lot of information into the elements and requests that affect performance of a specific web page, such as images, HTML, CSS, JavaScript, hosts, DOM, and more. Typically, the more elements you have, the longer it takes a page to load, but that’s not necessarily the case all the time. The good thing is that because it’s a visualization of load page time over a timeline, you can quickly see which elements are hindering performance and when they occur as the page loads.

The Dotcom-Tools website speed test from Dotcom-Monitor provides users with a basic summary and pie chart visualization of the page, along with a breakdown of all the elements and their sizes, the slowest and fastest elements, a breakdown of performance, errors, and the full waterfall chart. Additionally, you can see the website speed load time from a repeat visit, so you can compare times with the initial test. Other website speed test tools offer the same features and functionality in a similar manner, however, the website speed test tool from Cloudinary is primarily focused on image analysis and optimization. You’re not going to see a full breakdown of web page elements like you would with other website speed test tools we’ve mentioned.

One of the most important factors when running a website speed test is location. Your visitors come from all over the world, but maybe the majority visit from specific geographic locations. It’s important that the website speed test tool you choose offers the ability to test from multiple locations, so you can bet a better idea of the actual performance as seen by the user.
Looking at some of the popular website speed test tools on the internet, some offer a more comprehensive list of locations and options than others. For example, the website speed test tool from Pingdom offers seven locations, but you can only use one at a time for a test. Similarly, the free website speed test tool from GTMetrix offers one location in Vancouver, Canada, but you must sign up to get access to their other locations. Uptrends is like Pingdom, in that you can only test from one location, but they offer 11 locations total and options for browsers and mobile devices. And finally, KeyCDN offers 10 locations, but again, you can only test one at a time.
The website speed test from Dotcom-Tools by Dotcom-Monitor offers users to select up to 25 locations for a single website speed test, so you can test your website speed from multiple locations at one time. One You don’t have to run them one by one. Also, users have the option to select from locations in China, behind the Great Firewall of China, and includes options to choose from seven desktop and mobile browsers, such as Chrome, Firefox, Internet Explorer, Android, iOS, and Blackberry. After the test is complete, you’re able to view a summary of the performance, full waterfall charts, errors (if any were encountered), and Lighthouse reports, giving you all in the intel you need to begin optimizing your website speed.
Lastly, Dotcom-Tools offers additional free tests and tools, such as a ping test, DNS/traceroute test, DNSBL (DNS Blacklist), web and email server tests, the EveryStep Web Recorder to test web application performance, as well as several other free tests.
View all the free tests and tools.
Website Speed Testing Terms
Waterfall Chart
A waterfall chart is a visual display of all the elements and resources that were downloaded, in order, during page load and includes metrics about DNS, connection, SSL, CSS, JavaScript, images, plugins, and more.
First Visit
First visit refers to the time a user accesses your page and has no resources stored in their browser, or an empty cache.
Repeat Visit
Repeat visits, or cached mode, are used to show how the page loads when the user accesses your page for a second time when resources are stored in their browser. This allows resources to be pre-cached, so resources don’t have to be downloaded again, making page load times faster for the user.
Load Time
In website speed tests, the load time is the one metric that is used most often to benchmark performance. It is the time it took for your page to be completely downloaded, rendered, and then displayed to the user.
DNS Time
The DNS (Domain Name System) time refers to the time it takes for the DNS to resolve the various hostnames and their resources. For example, if your site uses third-party elements, like Google Analytics for example, it will have to perform a lookup for the Google Analytics domain along with your domain.
Connect Time
Connect time, or TCP (Transmission Control Protocol) connection is the time it takes to create a connection between the client and server. The client and server must connect before data communication starts.
SSL Time
If your site uses HTTPS for a more secure connection, the SSL (Secure Sockets Layer) time refers to the time it takes the browser to finish the SSL handshake.
Time to First Byte
Time to first byte (TTFB) is the time it takes the browser to receive the first byte of data from the server.
Response Time
Response time refers to the time it takes the browser to send a request and HTML is downloaded.
DOM Load Times
The DOM (Document Object Model) load times is the time it took to load and build the DOM. Other components, such as images and scripts may still be loading at this time. Website speed tests can help identify any DOM elements that may be blocking or delaying load time.
Response Codes
Response codes, commonly referred to as HTTP codes or server response codes, can tell you whether or not specific HTTP responses were successful. For example, 200 codes will show you successful responses. Any 400 or 500 responses are error responses. 400 error responses indicate that there is a client issue. 500 error codes identify any server response issues.
First Contentful Paint
First Contentful Paint (FCP) is a metric tracked in Lighthouse. It measures the time it took the browser to render, or paint, the first bit of content from the DOM.
Time to Interactive
Time to Interactive, or TTI, is another Lighthouse metric. It is defined as the time it took for the page to become interactive, or ready for input by the user.
First Meaningful Paint
First Meaningful Paint (FMP) is the time it takes for a page to download, or render, “meaningful” content from the perspective from the user. Meaningful content differs by page, but it typically occurs when the top header, navigation, and any above-the-fold elements, etc., are ready.
Largest Contentful Paint
Largest Contentful Paint measures the time it took for the main content of a web page to be downloaded and ready for use, within the users view. This metric is specific to images, blocks of content, or background images. Videos elements are not used in this metric. This metric is also geared more to mobile devices, rather than desktop devices.
First CPU Idle
Another Lighthouse metric, First CPU Idle is measured by the time it took a user to first interact with your site, such as clicking on an image, and when the browser responded to their click, or interaction. You want a speed between 0-130ms
Speed Index
Speed Index is the time it takes for all the above-the-fold content to render. In terms of Lighthouse reports, the quicker they are ready, the higher your Speed Index score.
Google Website Speed Test—Is It Any Better?
Google PageSpeed Insights (PSI) is a website speed test tool that, along with provided Lighthouse reports, provides performance results for both desktop and mobile devices. The test doesn’t include the option of testing from specific locations. Its primary focus is being able to provide data on on-page elements that may be slowing down web page load speed and recommendations on how to improve page speed performance and load times. The tool provides users with a score out of 100. Anything over 90 is great, but anything between 50-90 requires attention. PSI is great for quickly finding what items may need attention, but it doesn’t show performance from specific geo-regions, which is really what is required if you have visitors that are geographically distributed.


The GTMetrix website speed test tool provides users the ability to test their website performance and provides performance results through YSlow, which is an open-source web page analysis software. Your website is given a GMetrix grade, just like in school, from F to A. The version that’s available from their website allows you to test from a single location, Vancouver, Canada and through a Chrome browser. However, if you sign up for their free version, you can select from 7 locations, from regions in South America, Europe, and APAC. Their Pro plans, starting at $10, provide access to additional locations.
Like the Dotcom-Tools website speed test, the GTMetrix tool offers waterfall charts and Lighthouse reports that you can review after the test, which provides suggestions on specific elements that should be reviewed. They also have a video feature, which shows you how the page loaded and where bottlenecks occurred, but you must sign up for their free account to utilize that feature. Users also have the option to share the test results, either through a link or Facebook and LinkedIn. One thing that we found with GTMetrix is that sometimes the test took longer than 2 minutes and gave a time out error, so it may not be as reliable as the other website speed test tools.
Dotcom-Tools
The Dotcom-Tools website speed test by Dotcom-Monitor gives users to test, simultaneously, from 25 geo-regions, including from behind the Great Firewall of China. This is a big differentiator with other tools, as you don’t have to sign up and create any additional accounts. You can also run tests against different desktop and mobile browsers and devices. After running your test, users can review performance reports, along with reports from PageSpeed Insights. The tool also shows you load times from the initial visit, as well as the metrics from a repeat visit, so you can see how the results differ based on caching resources.
The results are provided in 5 different categories: Summary, Performance, Waterfall Chart, Host, and Errors. The results of each category are easy to read and include a glimpse into the fastest and slowest elements, so without digging into the waterfall chart you know which elements to prioritize. Lastly, the tool offers the ability to easily share your results via email, in PDF or CSV, with stakeholders and individuals of your choice.

Pingdom
The website speed test from Pingdom is another popular tool. One of the benefits of their free tool, compared to some of the others, is that you can choose from 7 locations. However, you can only test from one location at a time. Once your test is complete, they provide you with an overall summary of the results and a grade, from A to E. Any score below 50, or below a grade of F, is given an additional letter based on score results in increments of 10 points.
The results are nicely displayed and organized. Users are given recommendations to review as well as a waterfall chart of the results. Additionally, the Pindgom tool provides detailed breakdowns of content size and requests by type, as well as content size and requests by domain. The Pingdom tool doesn’t display the full waterfall chart, which can be ideal if your website has a lot of element to display. It displays every line in increments of 10 lines. However, you can quickly page through the results. Also, another great feature of the tool is that you can filter by 14 different criteria, such as load order, load time, status code, SSL time, and many others. Like the GTMetrix website speed test tool, users can quickly share results through LinkedIn, Facebook, or a standard link you can email. Users also have the option to download a HAR file of the results.
Uptrends
The website speed test from Uptrends is another simple tool for measuring website speed. Like some of the other tools in this list, Uptrends offers up 11 locations to test from, but you can only test one at time. The tool offers multiple desktop (Chrome, Internet Explorer, Firefox, and PhantomJS) and mobile devices (Apple, Samsung, Google, and more) to choose from, along with bandwidth throttling options (2G/3G/4G).
Once your test results are ready, the Uptrends tool displays the overall performance results, breakdowns, and pie charts. Items are broken out into various categories, such as object types, object bytes, response codes, and domains, so you can see which elements are taking up the most resources. Along with the breakdowns, users can also see the full waterfall chart and or filter the waterfall chart by different domain sources, such as ads, third-party resources, social, CDN, and first party. And like the other website speed test tools, you also have the option to share the results via a unique link.


WebPageTest
Another favorite tool among web developers is the website speed test tool from WebPageTest by Catchpoint. This tool offers some additional features and options that the other tools in this list do not. Users have the option of running a simple web speed test, an advanced speed test, a visual comparison of multiple websites, and a traceroute test. Running a simple speed test allows you to test from a single location (Virginia) and choose from desktop or mobile (3G/4G). The advanced test allows users to select from over 70 locations, mobile and desktop options, from around the world. Additionally, users can tweak their tests by choosing from different connection types (cable, 2G/3G/4G, LTE, and more), first or repeat options, and video capture. Like other tools, you can only select from one location at a time.
After the test is complete, users can see a full breakdown of the test, along with Lighthouse report, which is another option you can choose to display before the test. The tool provides you with a grade according to different metrics, such as security, first byte, caching, and others. Additionally, you can tab through and review summary data, waterfall charts, content breakdowns, screenshots, and more. One thing to note with WebPageTest is that there is a lot of data to parse through, which may make it a bit overwhelming for someone using it for the first time. They also partner with Cloudinary to provide image analysis and RequestMap to identify internal and third-party requests. One feature that is not available through the free WebPageTest tool is the ability to share results.
What is the Best Website Speed Test Tool?

in real browsers from 25 locations worldwide
How to Read a Website Speed Test Waterfall Chart
Waterfall charts can be a great tool for identifying performance bottlenecks and pinpointing exactly what elements are impacted and where in the page load process they occurred. However, waterfall charts can display a lot of information at once, so it might be difficult for someone that isn’t as familiar with them to easily distinguish what elements to act on. We’ll go through how to read, understand, and implement website optimizations based on the major factors that contribute to slow loading websites.

A quick glance at the sizes can show you any resource that may too large, such as images over a specific file size. If you have any images over 1MB, for example, this might be a good opportunity to compress those images so that they are smaller and load more quickly. Sometimes large, high quality images can really add to the branding and imagery of your website, but they ultimately impacting the user experience, causing your website load time to increase. This is especially important for mobile experience, where connection speeds vary, and high-resolution images can dramatically impact load times for users that have slower connection speeds.
Another factor for slow website load times is JavaScript code itself. JavaScript can make up a large piece of your websites, so a couple of recommendations to optimize your JavaScript is to minify it or remove the elements that aren’t critical to the page. Every time your page loads for a visitor, the JavaScript must load before proceeding to the next task. There are various plugins that can assist with this process. Other options include deferring JavaScript to load after the page is visible, load JavaScript asynchronously, which means it loads separately from the rest of the web page, or bring it inline, which essentially brings it into the existing HTML, helping it load faster. The great thing about website speed testing tools is you can see how much JavaScript makes up the weight of your page. An example of that is shown here.

These are just a few of the major factors that can contribute to slow loading web pages. One solution we have not discussed yet is using a CDN (Content Delivery Network). CDNs allow you to host your pages on servers located in different geographic regions, closer to where most of your visitors and users are located, instead of your own web server. Obviously, investing in a CDN can be a costly endeavor for some organizations, but if your website is going to see heavy traffic from multiple regions around the world, it might very well be worth the investment to provide a fast, reliable user experience.
Mobile Website Speed Tests
Do They Provide Any Additional Information?
We briefly talked about the importance of mobile device speed earlier in this article and how mobile devices are now used in over half of all online searches, but to reiterate, speed became a ranking factor for mobile searches 2018. For comparison, desktop speed was a ranking factor in 2010. Your site may still rank high if it’s loaded with great content, but if your website isn’t optimized for mobile, one of the consequences is a lower ranking in SERPs (Search Engine Results Page). As a web developer or marketer, it’s critical that you take into consideration what devices your visitors use and ensure that they are optimized for mobile devices.
Page Speed Test on Mobile vs. Desktop

When running a speed test for a mobile device and a desktop device, you might see that the performance results are different. There can be a few reasons for this. First, mobile device users are going to be greatly impacted by their connection speed (3G/4G/5G, Wi-Fi, etc.). Another factor can be how the page’s CSS is loaded. Mobile devices render CSS differently compared to desktop devices, such as resizing images and considerations around viewport/screen sizes. Lastly, location. Obviously, if you have a visitor from London accessing your page that served from the U.S., it’s going to be slower for that individual than for individuals in the U.S.
If we consider the website speed tests using PageSpeed Insights from Google, there are certain assumptions that are made. For example, the PageSpeed Insights tool uses what they call a “mid-tier device” (Moto G4) as the basis for the speed test. It’s important to find a website speed test tool that you can run with varying mobile devices, as they will provide more real-world results. Additionally, the PageSpeed Insights tool uses servers based only in the U.S. Again, you want to find a tool that allows you to test from locations around that world, as your visitors are likely not all to be coming from the U.S.
Load Testing vs. Speed Testing
The focus of what we’ve been discussing up until this point has been how to optimize your website so that it loads quickly and doesn’t hinder the user’s experience. Load testing your website takes the concept of website speed testing even further. Load testing is a form of performance testing that can show you how your website responds to heavy levels of traffic.
For example, if you’re going to be running a large promotion or you’re an e-commerce site that is preparing for Black Friday, the expectation is that you’re going to have hundreds, if not thousands, of visitors hitting your page at the same time. Load testing can help simulate these real-world heavy load scenarios, so you can understand how your website performs so you can identify performance bottlenecks, scalability issues, performance degradation, and how infrastructure and throughput metrics like CPU, RAM, disk I/O, and bandwidth change with varying load level. Load testing can help answer questions like the following:
- How many concurrent users can my website handle before performance is impacted?
- How do simultaneous users affect application or website performance?
- How many user transactions can my website or application handle?
- What is the breaking point? When will the page run out of resources?
Load testing is a critical step in understanding how real users will be impacted during periods of heavy traffic. There are some great solutions that help automate the load testing process and we’ll talk more about those in the sections below.
Why Load Testing Helps Your Website Speed
One of the main goals of load testing is to simulate, as closely as you can, the real-world traffic that you expect your websites, applications, and systems to be able to manage without crashing. If you manage an online shop, there will probably be times where traffic spikes, as they tend to do around big shopping holidays, but load testing provides you with the security of knowing that your system should be able to respond normally during those peaks in traffic. Part of the load testing process is to define those components and elements that, when under stress, show signs of performance degradation. Once those elements have been identified, you should be able to more easily prioritize and fix those bottlenecks, which in turn, help to decreasing website page load times. Like we have mentioned before, a slow website load speed is the number one factor that can turn away a potential visitor.
Additionally, load testing can help with determining how your applications react to spikes in traffic. Today’s web applications are built, and rely on, many technologies and third-party components. These web applications serve to provide a more dynamic experience than the web pages of old. Again, load testing can help identify those elements that are crucial for the functionality and overall performance of your applications, and in turn, the end user experience. If it’s not speedy enough, they will find another application that is.
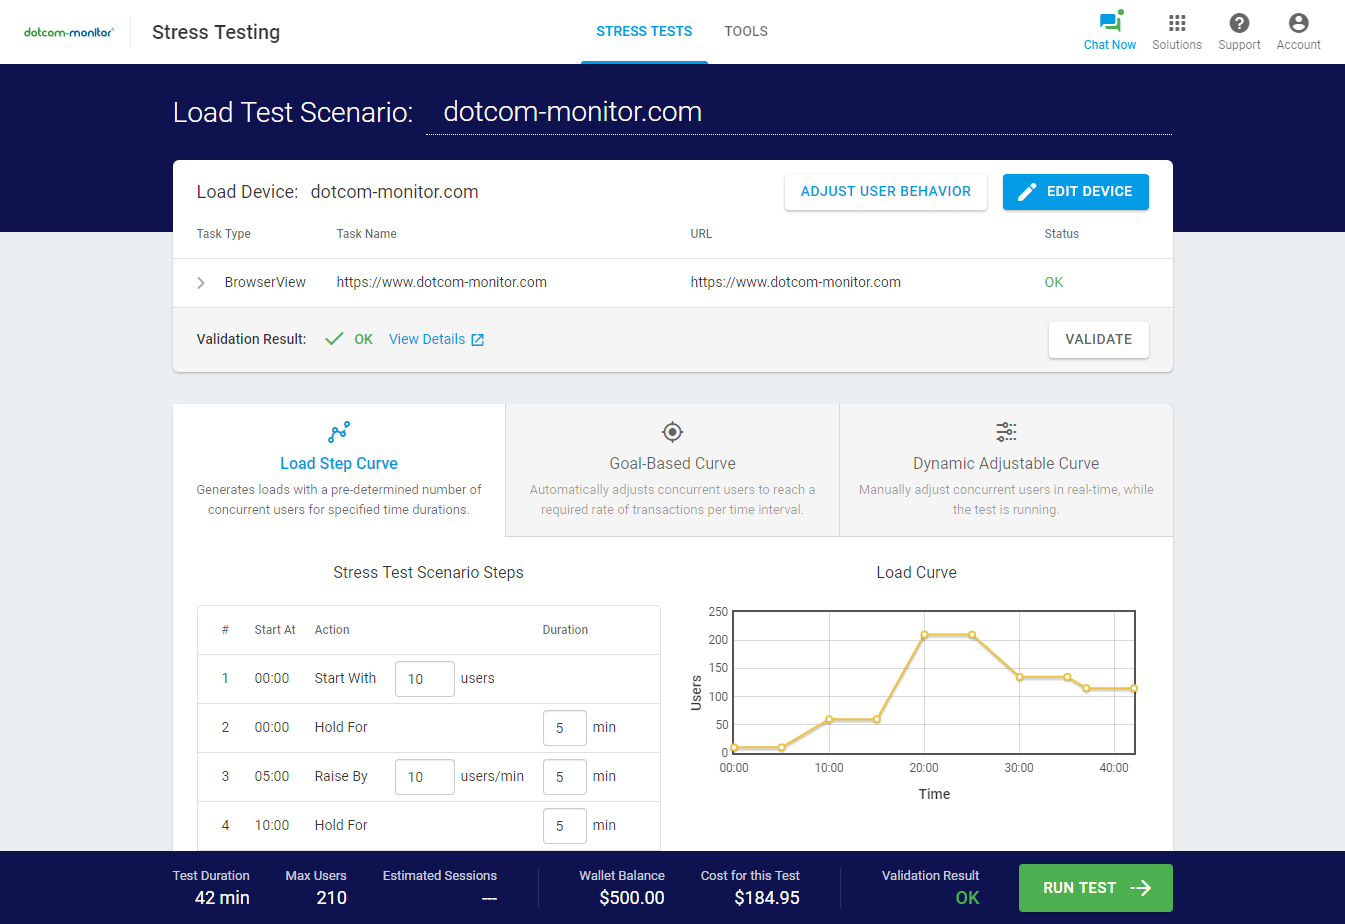
Improving Your Website Speed with LoadView
LoadView is one of the best performance testing solutions in the market today. The solution is entirely cloud-based, so there’s no need to invest in any additional infrastructure, hardware, and the headaches and paperwork that come along with having to manage all of that. LoadView is perfect for load testing web pages, but it can also be utilized to load test streaming media, APIs and web services, and web applications as well. LoadView also uses real browsers, so you easily set up your tests to gauge performance within browsers like Chrome, Internet Explorer, Android, and iOS.

Some load testing tools can only provide protocol-based testing, which is good for some cases, but when your goal is to uncover how your website load speed is impacting users under specific load conditions, you need a platform that uses real browser-based testing, so you get more accurate test data back. Your users use real browsers, so should your load tests. In addition to that, LoadView provides some other great features, like the ability to choose different load curves, define network conditions (which, as we discussed before, is critical for mobile devices), and a network of over 20 load injector servers to choose from. All these features help developers and DevOps teams run more accurate and efficient load tests.
And not only that, the LoadView solution is just one of many solutions within the Dotcom-Monitor performance testing and monitoring platform, so if you want to monitor your web pages, web applications, and APIs in production, you can easily set that up through the same pane of glass.
Testing Web Server Speed
Along with testing your website speed, you should also test the performance of your web server by running a web server speed test. Ensuring your web server is properly tuned and that hardware and infrastructure is optimized and sized appropriately is critical to the performance of the web applications and websites it serves up to your visitors and users. A web server speed test shows you metrics on response times, certificate validity, any DNS errors, along with any specific server or DNS error codes, so you can know where to start if there are any server or DNS issues.
Most of the time, the reasons behind your website loading slowly are due to front-end issues that we discussed earlier, like images, CSS, JavaScript, etc. However, if you’ve optimized these assets and varying resources, but your site is still loading slowly, you may be looking in the wrong direction. Testing your web server performance, and seeing slow response timed, could be the result of hardware issues, network connectivity, or your web hosting service.
Lastly, it’s important to use a tool that can test your web server speed test against multiple global locations and endpoints, so you can get a good feeling of how web server speed compares against different regions, and where specific performance issues lie.
How Do I Check My Server Speed
If you’re wondering how to check web server performance, the web server speed test from Dotcom-Tools by Dotcom-Monitor can give you a quick glimpse into server metrics from nearly 30 locations around the world. The test is very straightforward, simple to use, and gives you at-a-glance metrics so you can quickly identify areas that may need improvement.
To begin the test, simply enter the URL that you want to test. The web server speed test accepts sites that are HTTP or HTTPS. HTTPS are different than HTTP sites in that they utilize an SSL Certificate, which provides users a more secure browsing experience, as any data that is submitted is encrypted and protected. Visitors are more likely to trust sites and businesses that utilize SSL Certificates. SSL Certificates are especially important for banking/financial institutions and e-commerce sites and applications for protecting your banking information, credit card data, and personal information.
For HTTPS websites, you can check your certificate Common Name (CN), authority, date, revocation, and usage. Advanced web server checks include testing GET/POST parameters, verify login with a username and password, and check any specific HTTP headers. Once the web server speed test has started, you will see server response times by location, along with any pertinent data regarding certificate or DNS errors, HTTP error codes, or instances where the connect timed out.
Web Server Response Test vs. Web Server Speed
When executing web server speed tests, you may see different error codes and descriptions that aren’t necessarily related to the web server speed. HTTP status codes are used to help you differentiate between valid responses and error responses. There are five groups of HTTP status codes, but some of the typical HTTP status codes you may run into when running your web server speed test include the following:
- 2xx. The 2xx category of codes indicate to you that any actions from the client were received successfully.
- 3xx. The 3xx category identify where additional actions must be taken by the browser, or the request was redirected to a different target. The 3xx codes are typically used in URL redirection
- 4xx. The 4xx category show client errors. The common 4xx code you will see is a 404 error, which tells you the requested resource could not be found.
- 5xx. The 5xx category is reserved for server errors. A common error you will see is a 500 error code, which tells you there was internal server issue. A 502 or 504 error means there was a bad gateway, which means an issue with hardware, like a router or a switch.
Server responses and the speed your page loads, as perceived by the user, cannot be taken independently. It’s important to look at all the server-specific metrics along with response times, so you can better understand where performance issues exist. The professional solutions from Dotcom-Monitor can monitor all these metrics, giving you full visibility into how front-end and back-end component and elements affect overall performance.
Improving Your Web Server Speed with LoadView
Along with the client-side metrics, load testing your website or application also gives you data on these efficiency metrics, such as throughput and utilization. Throughput focuses on how many requests are made to your site or application over a given amount of time. Utilization refers to the capacity of the resource being used. During periods of high visitor traffic, if your utilization rates increase, this directly impacts response times, leading to slower loading pages and applications. This is where a solution like LoadView excels. The platform gives you the ability to set up the exact user scenarios and load curves, offering insight into these metrics and how your IT teams should properly size your infrastructure to be able to meet performance SLAs.

List of Website Speed Testing Tools
1. Dotcom-Tools
Dotcom-Tools by Dotcom-Monitor is the number one website speed test on our list. Their speed test tool allows users to test their websites from 25 locations around the world, including North America, Europe, Asia, South America, Africa, Australia, and the Middle East. Unlike other website speed test tools that only allow you to test from one location at a time, the website speed test tool from Dotcom-Tools allows users to test from all 25 locations simultaneously and provides data on first visit and repeat visit metrics. Users also have the option of selecting from real browsers, including desktop (Chrome, Firefox, and Internet Explorer) and mobile (Android, Blackberry, iOS, and Windows Phone). Once your test is done, you can review metrics and data through waterfall charts, summary of performance, and Lighthouse reports, making for a very comprehensive free tool for users. And it’s not limited to testing website speed. They also offer additional free tools, such as DNS trace, ping test, network latency, email blacklist, and streaming media.
2. Pingdom
Pingdom is known for their commercial synthetic monitoring and RUM solutions, however, they also offer a free website speed test tool. Their website speed test tool gives users the option to choose from one of seven locations. Locations range from cities in North America, Europe, Asia, Pacific, and South America. However, you can only test from one of these locations at a time. Their commercial offerings allow users to select from over 70 global locations. The speed test results include an overall performance grade along with a summary of results, suggestions of page improvements (with current grade), a breakdown of HTTP response codes, a breakdown of content and requests, as well as a waterfall chart to view element-level detail.
3. Google PageSpeed Insights
PageSpeed Insights from Google provides users with performance insight on their web pages, on both desktop and mobile devices. Users can enter their URL and PageSpeed Insights provides you with a score between 0-100. The higher the score the better. PageSpeed Insights provides data about on-page metrics, such as First Contentful Paint (FCP), Largest Contentful Paint (LCP), where improvements can be made, and which elements passed their audit. Unlike other website speed tests, their tool utilizes historical data based on a given URLs past performance, as well as lab data that assumes a specific network speed and device for all tests. Obviously, in real-life situations, your visitors come in from anywhere in the world on any number of devices and browsers, but Google’s PageSpeed Insights can give you some tangible data to start making improvements to your website. And if you’re looking to rank better in SERPs, don’t ignore Google’s recommendations.
4. GTMetrix
GTMetrix is another popular website speed test tool. Their free website speed test tool allows you to check a single URL from Canada using a Chrome browser. If you’re looking to test from additional locations and devices, you’d have to create an account to access those additional features. Once the speed test is finished, users can see the overall grade of the page performance, which is based on the page’s front-end structure and actual performance as the user perceived it. One of the great features of the GTMetrix test is a visualization of the load time and where key metrics, like First Contentful Paint, Time to Interactive, and Time to First Byte occurred. The results also include where improvements can be made, waterfall charts, and additional tips and suggestions.
5. KeyCDN
KeyCDN offers a straightforward and simple website speed test. Users can choose from 10 locations around the world (North America, Europe, Asia, and Pacific), however, like similar tools, you cannot test them simultaneously. Upon test completion, users can see an overall performance grade, along with metrics on overall page speed load time and requests. Additionally, the KeyCDN website speed test tool provides a line-by-line grade of all the performance elements and provides suggestions for improvement for each. Examples of this may include removing unused JavaScript, optimizing images, using a CDN, or minifying CSS. Also provided at the bottom of the results are breakdowns and visualizations of content metrics like load time, content size, and requests by content type as well as requests by status codes and domains.

6. WebPageTest
WebPageTest is provided by Catchpoint. Catchpoint is a Digital Experience Monitoring (DEM) platform, combining synthetic and Real User Monitoring (RUM) to measure the end user experience. Their free website speed test tool offers users a simple website test, along with a test that offers more advanced options. The simple website speed test tests a given URL from either a desktop (Chrome) or mobile device (Chrome, 3G/4G options). Their advance test gives user the option to choose from over 70 different combinations of desktop and mobile locations/devices/browsers. Users are given overall grades, based on different metrics, as well as over nine different categories, such a Summary, Content Breakdown, Domains, and Performance Review.
7. Uptrends
The website speed test from Uptrends gives users a glimpse into what how their websites perform on desktop and mobile devices, as well as performance tips and recommendations from Lighthouse reports. The tool offers users the ability to select from one of 11 locations located in North America, Europe, Asia, and Asia Pacific. Like other tools on this list, users can only test from one location at a time. Users can select from desktop and mobile devices, such as Chrome, Internet Explorer, Firefox, and headless browser Phantom JS. Mobile devices include Apple, Google, Samsung, etc., along with the ability to choose network condition (2G/3G/4G). Users are given a summary of the performance data, as well as waterfall charts, as well as breakdowns of content, objects, and response codes. Uptrends also offers other free tools, such as a ping tests, find my IP, and response header checks.
8. Cloudinary
As we mentioned earlier in this article, the images on your site can be source of bottlenecks during page load time. If images aren’t compressed/optimized, your users will likely be left waiting and watching for something to happen, which is never a great first impression for someone just landing on your site. The website speed test from Cloudinary is strictly an image analysis tool. After entering your URL, the tool analyzes all the images, and gives you an overall grade, along with the total number of images analyzed and size, and how much image weight you could save after optimization/compression.
9. Dareboost
Dareboost provides a website speed test for users from a single location (Washington, DC) from a Chrome browser. In order to access all their 13 global locations, you must sign up and create an account. After analyzing your URL, users are given an overall score, out of 100, along with noted issues and suggestions where improvements can be made. A video playback is also included so you can see where specific content was rendered during the test. Users can also access the waterfall chart to view all the elements and components during page load time and filter by specific timings, such as DOM Loading, DOM Complete, Start Render, First Contentful Paint, as well as many other metrics. The waterfall chart can be downloaded as a HAR file or users can opt to share the test by email.


10. Sucuri
The Load Time Tester from Sucuri shows you how long it takes your web page to fully load. The tool compares times against 11 global locations (North America, Europe, Asia, Asia Pacific, and South America) and displays metrics like connection time, time to first byte, and the total time. The results are also averaged, so you can see the average response times of each metric, along with an overall grade, based on the total load time. Below the initial metrics, users can also see a chart of the history of the various performance statistics over time. This is great for seeing how your site performance has changed, good or bad, over time.
All from one convenient load testing solution.
The Ultimate Website Speed Testing FAQ
Website speed testing is not a “one and done” type of task. As your pages change and content is updated, it will become necessary to test your web pages on a continuous basis. As we’ve outlined in this article, there are many aspects to consider, from on-page enhancements like compressing and optimizing images, combining JavaScript and CSS, to even going as far as considering a CDN to assist with delivering faster page load times across different geographic locations. Additionally, organizations and teams can’t just focus on web page content improvements. Performance considerations need to be made based on web server performance, hardware requirements, and network connectivity.
Your pages may already load fast, but how your users and visitors perceive your website speed may be another thing. Running a website speed test may uncover opportunities to make your website load even faster or may uncover areas where a third-party element or component is affecting performance. And it’s not just for the user experience. Faster website load times plays a major role in SEO rankings. A website that is fast will more than likely rank higher in SERPs, giving your site more visibility and opportunity to engage with a larger audience and hopefully bring in more customers and users.
Below are some frequently asked website speed testing questions and answers.
Table of Contents
- How do I test website speed?
- What is the best website speed test?
- How do I run an online website speed test?
- What should I look for in a good website speed test?
- How do I run a root server test?
- How do I load test an email server?
- How do I run an Exchange mail server test?
- How do I check a POP3 email server?
- How do I test Minecraft server performance and availability?
- How do I test connection to a local FTP server for performance?
- Will load testing help the performance of my FTP server?
- How do I test latency to a web server?
- How to I run a DNSBL server test?
- How do I test my DNS servers online?
- What is the best load testing tool to improved website speed and performance?
How do I test website speed?
You can test your website speed through one of the many free tools available on the internet, such as the website speed tests from Dotcom-Tools, Pingdom, GTMetrix, WebPageTest, and others. We have discussed many of the free tools available, along with their features, benefits, and other factors that differentiate each tool from the others. When considering a website speed test tool, make sure you find one that can test from multiple locations, uses real desktop and mobile browsers, and can provide you with the reports, summaries, and opportunities where improvements can be made. Also, being able to share your results with other team members and stakeholders is beneficial so everyone can see where the current baseline is, and after making improvements, you can compare and monitor your results against future website speed tests.
What is the best website speed test?
The best website speed test comes from Dotcom-Tools by Dotcom-Monitor. Their free website speed test allows web developers and webmasters to run their website from up to 25 locations simultaneously Compared to other website speed testing tools we have reviewed, Dotcom-Tools is the only website speed test that is able to test from more than one location at a time. This saves developers a lot of time by being able to test from all the geographic regions their website visitors and users come in from, giving a better real-world view on performance. Additionally, Dotcom-Tools provides great reports, waterfall charts, and Lighthouse reports that give actionable insights into where performance issues lie.
How do I run an online website speed test?
Running an online website speed test is straightforward. You enter your URL, select the location or locations you want to test from, and choose from any number of browsers or devices. Just note that not all online website speed tests are created equal. Some may offer limited, or more features, than others. Some online website speed tests provide a limited set of features, but in order to access more robust features, you must create an account first. This can be a barrier for some that are looking to test from different locations than what the test offers.
What should I look for in a good website speed test?
There are many good website speed test tools, but some provide more features than others. A good website speed test should be free to use, allow you to test from multiple geographic locations, and provide detailed reports that include suggestions on improvements. Additionally, a company that provides a website speed test tool should also include other free tools to support and check overall system performance. For example, ping tests, web server speed tests, DNS trace, FTP test, and more. Not only is it important to make on-page optimizations, but back-end services must also be running optimally to ensure content is being served efficiently.
How do I run a root server test?
A root server, also referred to as a DNS server or root name server, is the name given to servers that are responsible for DNS functionality. The DNS systems is responsible for turning domain names into numeric addresses. For example, the numeric address for google.com can be 172.217.4.100 or 2607:f8b0:4009:800::2004. Google also maintains several different IP addresses based on different geographic locations, not just these two. There are 13 main, or logical DNS root servers in the world, but over a thousand top-level domains (TLDs). A root server test can show you the paths taken to retrieve DNS authorization, as well as response times, from different locations. A root server test will show you which specific regions may be experiencing DNS issues.
How do I load test an email server?
In addition to load testing your websites, web applications, APIs and streaming media, for example, you can also load test your email server. Email is still one of the most used communication methods. Most organizations have and manage their own email server, but traffic is typically low and inconsistent. There may be instances where load testing your email server is necessary. For example, to ensure your email servers can handle spikes in email traffic or to ensure your email servers can scale as the organization grows. Like load testing your website with simultaneous concurrent users, load testing your email server can be accomplished by sending a large volume of emails to your email server. You’ll be able to see how many emails your server can handle before they start bouncing back or where latency issues begin.
How do I run an Exchange mail server test?
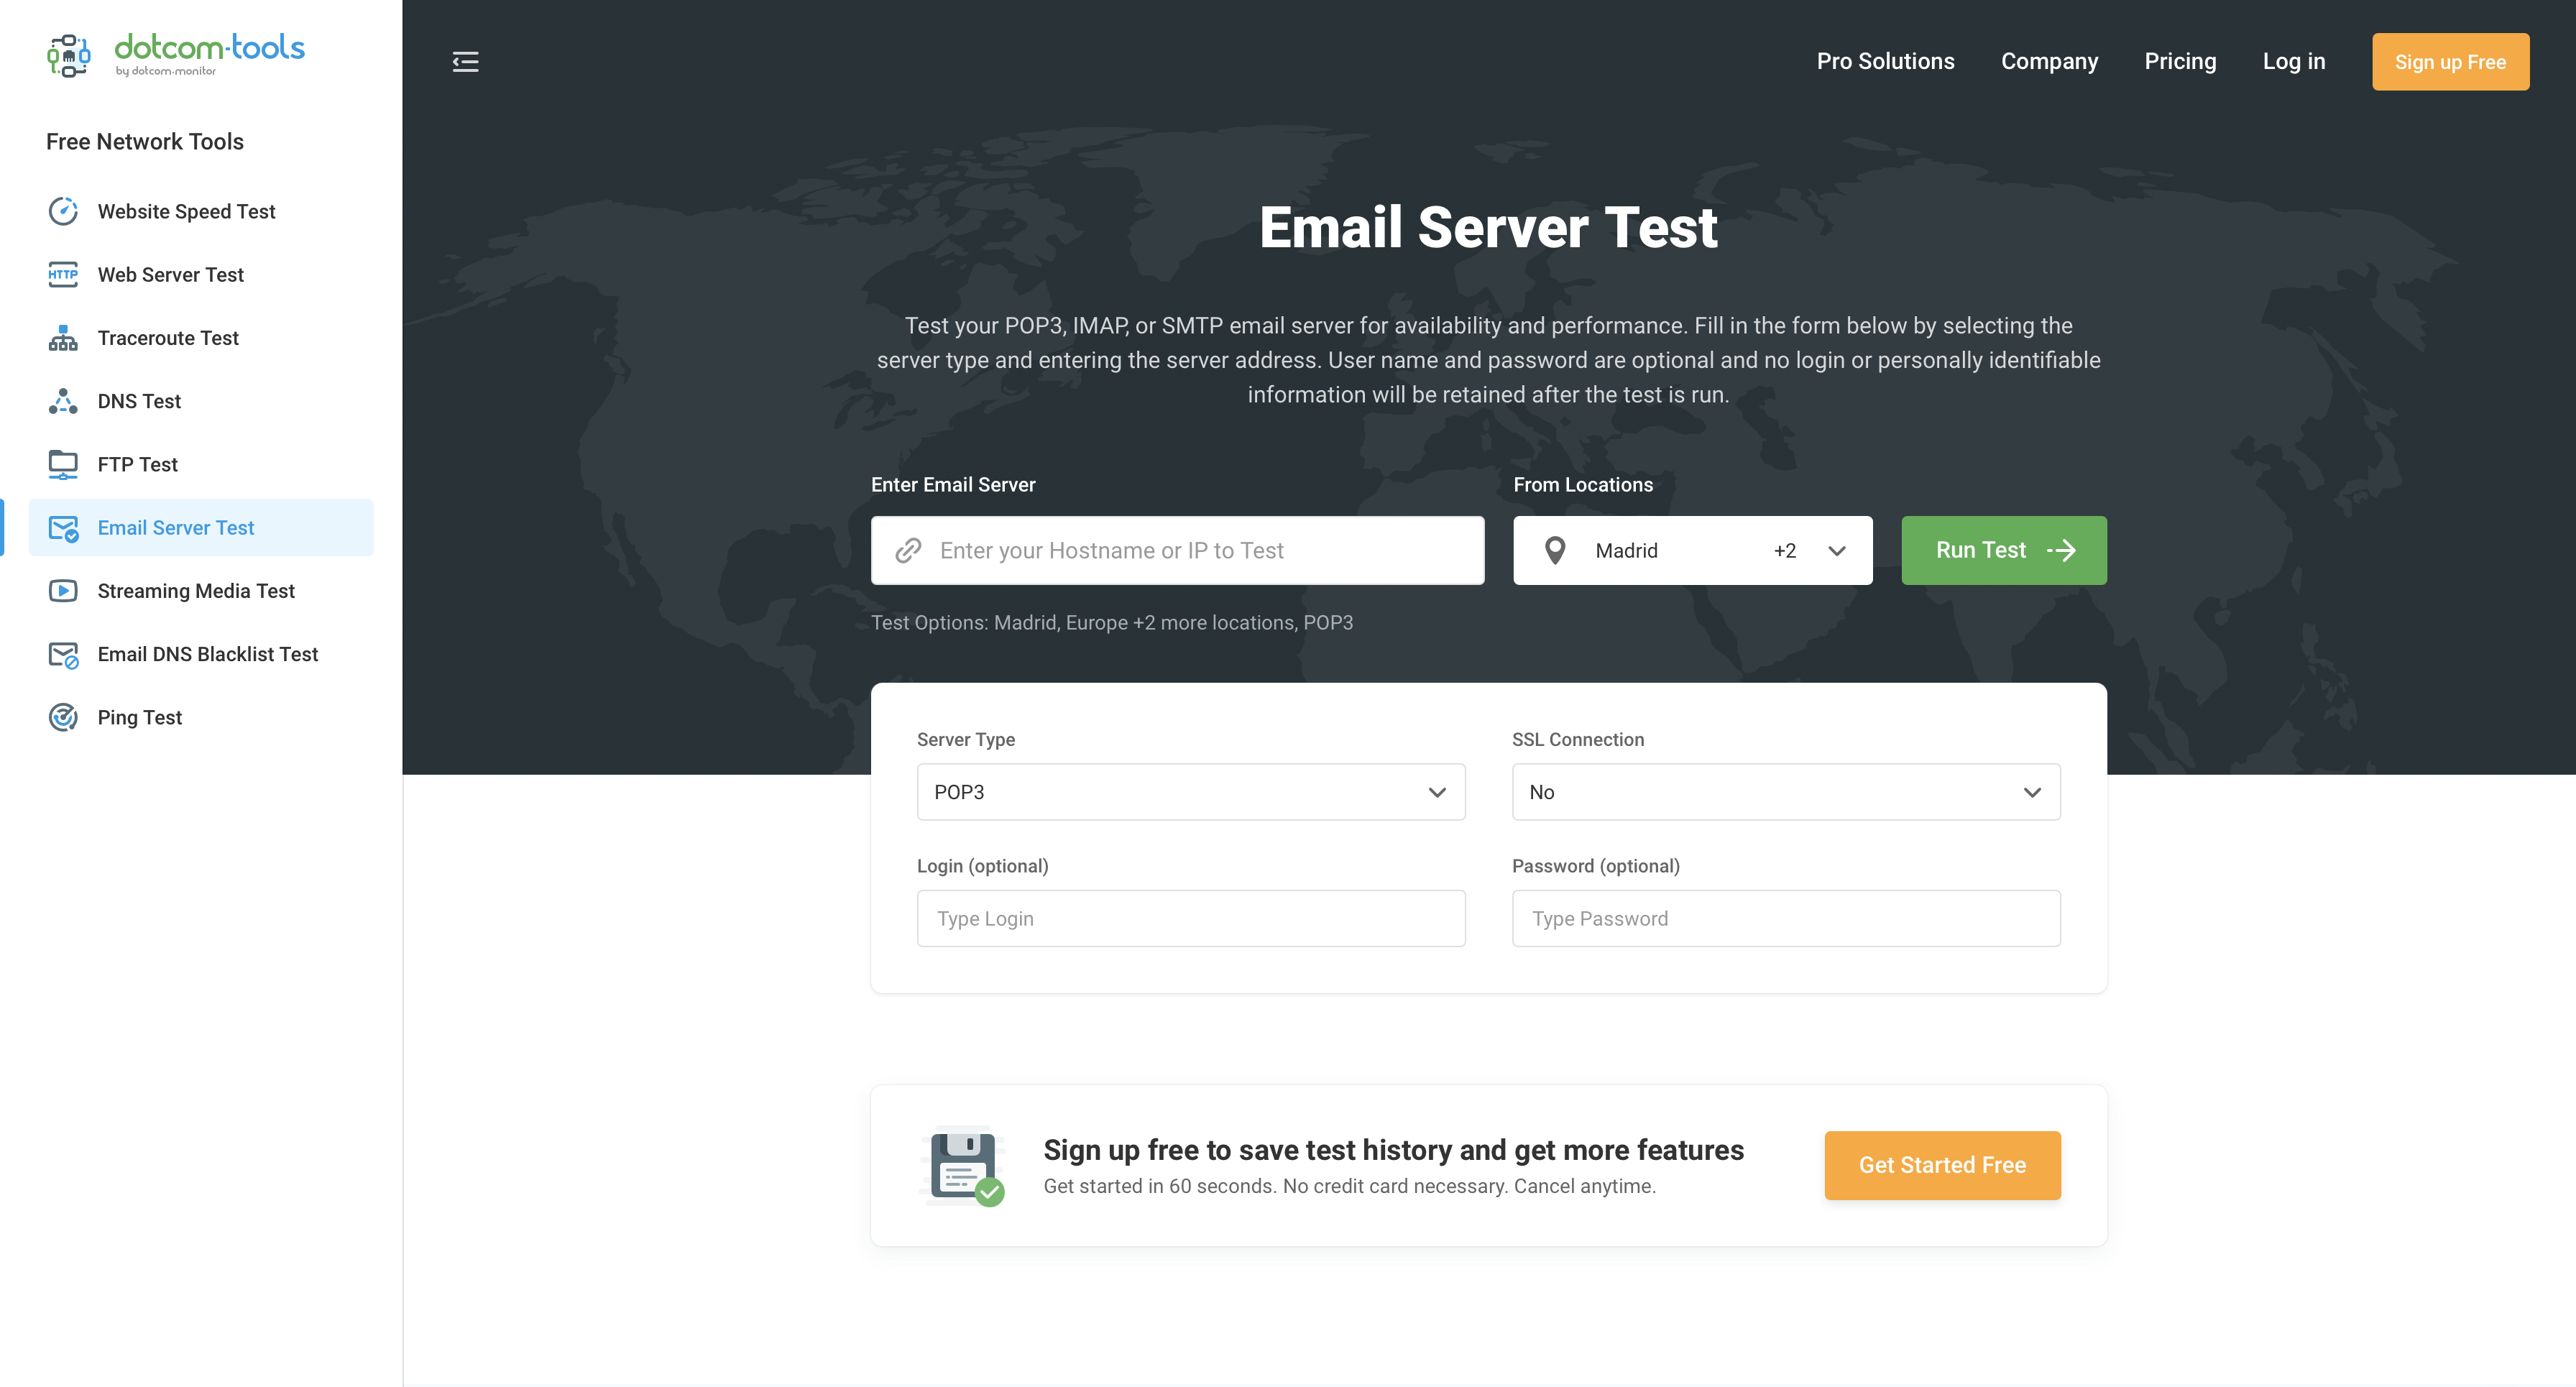 Microsoft Exchange is a widely used email server. You can test your Exchange mail server for connectivity, availability, and performance. Microsoft Exchange supports a few different protocols, such as ActiveSync, SMTP (Simple Mail Transfer Protocol), POP (Post Office Protocol), or IMAP (Internet Message Access Protocol). With the Email Server Test from Dotcom-Tools by Dotcom-Monitor, you can run a quick, secure check of your Microsoft Exchange Server. You can pick from your server type, POP3, IMAP 4.1, or SMTP. The email server test will run a quick connectivity check, and within a few moments, be able to quickly tell you if any of components of your email server are experiencing issues.
How do I check a POP3 email server?
Like we mentioned above, POP3 is a protocol that is used by email servers. Its main benefit is that it downloads your emails from a remote email server and then they are stored on your device, making your emails available to you even if you’re offline, or not connected to the Internet. Similar to testing your Microsoft Exchange Server, you can run free test through the Email Server Test through Dotcom-Tools. Simply select POP3, enter your email server location (hostname or IP address) and view the results and ensure connectivity and availability to your POP3 email server, as well as if there are any errors.
How do I test Minecraft server performance and availability?
If you’re a gamer looking for the fastest Minecrafter server, you can run a ping test to see which servers are available and have the least amount of lag. In gaming, like website performance, speed is everything. If games respond slowly, or have intermittent performance issues, it’s not a great experience for the player. There’s a lot of Minecraft servers available, some of the more popular ones include Mineplex, Hypixel, and Autcraft. With a quick search, you can find their domain or IP address. Using the Ping Test from Dotcom-Tools, you can enter the domain or IP address and quickly see response times (in milliseconds) from nearly 30 locations around the world, along with status and error codes, if an error was encountered. This way, you can see which Minecraft server is responding the best and choose that server.
How do I test connection to a local FTP server for performance?
FTP servers are used to transfer files and data between computers. FTP stands for File Transfer Protocol and is a protocol that has been used since the 1970s to more securely send files and data between computers. With FTP, one computer essentially acts as the server and the other acts as the client, requesting or sending data as necessary. There are many free tools that can help you test the connection to your local FTP server to ensure availability and performance. The FTP Server Test from Dotcom-Tools can test your FTP server from nearly 30 global locations, giving insight into availability and performance.
Will load testing help the performance of my FTP server?
Although load testing is mainly reserved for testing your websites, applications, an APIs, or other web services that will see high levels of traffic, you can load test your FTP server to see how many files your FTP server can handle or to see the performance impact of many users transferring files at the same time. In real-world scenarios, if your FTP server is bogged down, then files that would normally take a few minutes to transfer could end up taking hours. Like load testing any other type of server, ensuring you have enough capacity and throughput to meet times of high demand is essential for the user’s experience.
How do I test latency to a web server?
Latency is the time between an action and a response. For example, if you click on a button on a web page, the time it takes the page to respond to your click is latency. In terms of networking, it’s the time it takes a packet of data to travel round-trip, otherwise known as ping. You can test web server latency by running a ping test. Ping tests can show you the response times between web servers and websites, as well as indicating any errors or failures that arise during the test. Running the Ping Test from Dotcom-Tools can show you web server availability and performance from nearly 30 global locations simultaneously.
How to I run a DNSBL server test?
A DNS Blacklist, or DNSBL, is list of hostnames or IP addresses that have been blacklisted, typically because someone identified or reported that address as sending spam emails. There are many blacklists and sometimes, organizations don’t even realize that their IP has been put on a blacklist until after the fact. This can cause emails to not be received by users. To check to see if your IP is on blacklist, you can run a DNS Blacklist Test from Dotcom-Tools. You can enter your hostname or IP address and the tool with check against a list of trustworthy and popular DNS Blacklist providers. If your IP or domain has been identified on any one of these lists, it will show up as a failure.
How do I test my DNS servers online?
Understanding and finding where DNS issues occur can prove troublesome. There are many layers, with multiple DNS connections and paths, between you and the root server, where issues can arise, and hidden from the user’s perspective. Running a DNS Trace Test from Dotcom-Tools can be a quick way to identify network issues that may be impacting your website. The benefit of testing your host with the DNS Trace Tool is that you can test from over 20 external, non-cached, global locations to verify availability. This will give you an idea if issues are arising from only specific locations, or if there is another issue, perhaps your local DNS cache, that’s the bottleneck.
What is the best load testing tool to improved website speed and performance?
The best load testing tool to improve website speed and performance on the market is LoadView by Dotcom-Monitor. The solution is completely web-based, so you don’t need to worry yourself with investing in any additional costly hardware. Simply create an account, find the monthly package that best fits your needs, or choose their on-demand plan for whenever your need for load testing arises. Or better yet, try the tool for free first before deciding your next steps. LoadView uses real browsers, to give you more accurate real-world results, as well as the ability to test from any one of more than 20 worldwide locations.
Next Level
Experience unparalleled features with limitless scalability. No credit card, no contract.