What is Auto Scaling?
Auto scaling is a method associated with cloud computing that automatically increases or decreases the number of resources you have in your application, at any time according to their needs. Before using cloud computing, it was very difficult to automatically scale a server installation. In a physical hosting environment, your hardware resources are limited, so we will experience performance degradation in the application, or our application will crash.
Today, cloud computing makes it possible to create a scalable server setup. If your application needs more processing power, auto scaling provides users with the ability to use and terminate additional resources as needed. Auto scaling provides for an efficient way to use resources only when necessary, ensures your application has the capacity when demand increases/decreased, and most importantly, saving you from potentially paying for more than your organization needs. Let’s dive deeper into auto scaling, how it works, and the benefits it offers organizations.
Why Auto Scaling is Necessary
Auto scaling is very functional when your application needs additional server resources to accommodate the number of page requests or rendering. It offers you a scalable capability to automatically scale or shrink to meet your needs. Auto scaling offers the following advantages:
- Automatic scaling allows some servers to go into sleep mode during low load times, reducing costs.
- Increased uptime and greater availability where workloads vary.
- On the front-end site, it provides the ability to scale based on the number of incoming requests.
- On the back end, it provides scale based on the number of jobs and how long jobs have been in the queue in the queue.
Using LoadView to Ensure Auto Scaling Works Properly
LoadView is a web-based load testing solution that can test everything from APIs and web pages, to complex user scenarios within internal/external web applications. Loadview shares with the tests it runs reports that help find problems and glitches that slow or delay our system. When load testing web pages, for example, you can test a specific page against hundreds to thousands of concurrent users to see how the page performs under specific load levels.
When testing user paths, LoadView, along with the EveryStep Web Recorder, turns your screen into a script to test real-time interactions with applications, capturing all actions performed, and can be replayed under load.
LoadView Setup
For our example, we will test an internal application. When testing internal applications, the IP addresses must be whitelisted before performing load tests on internal applications. Through the load Injectors, we can whitelist IPs and perform tests with against numerous concurrent users.
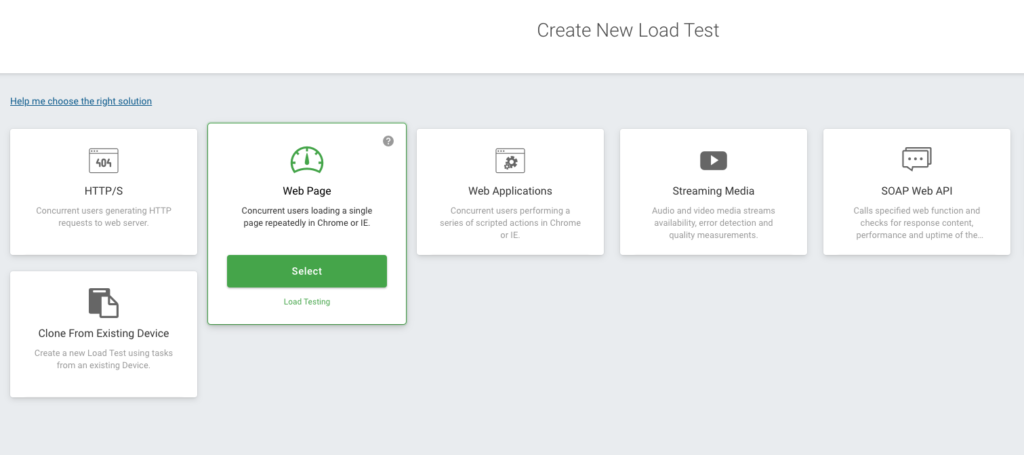
The LoadView main page opens, and you will see several different options, such as Web Applications, APIs, Web Pages, Streaming Media, etc. We will select the Web Page option.
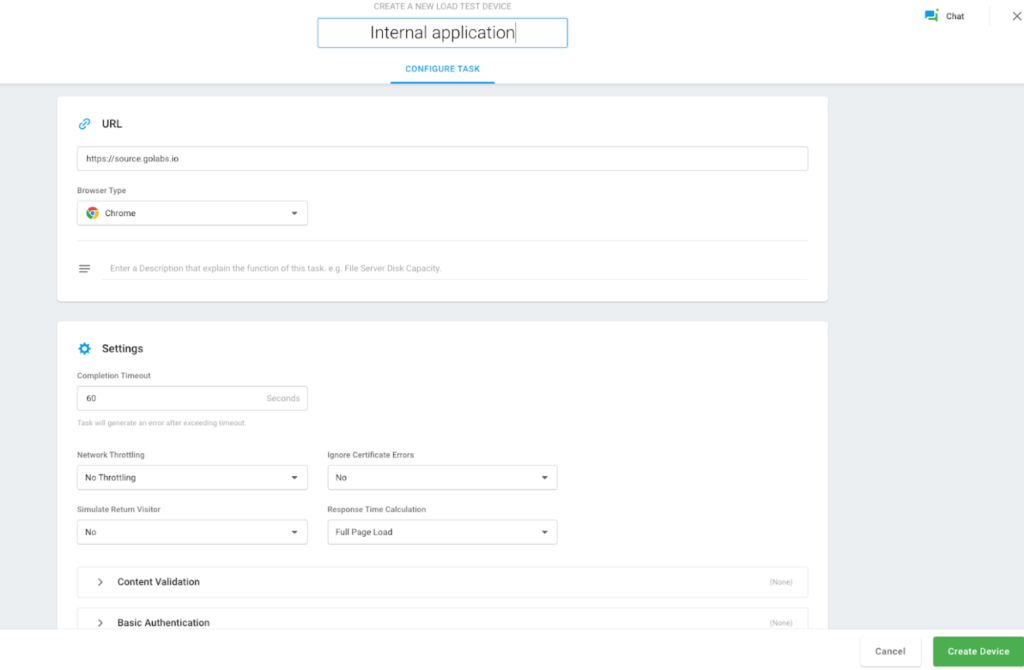
A new page opens where we can add the desired time to run the load test, add our internal website hostname, our browser, etc. After entering your details, click the Create Device button.
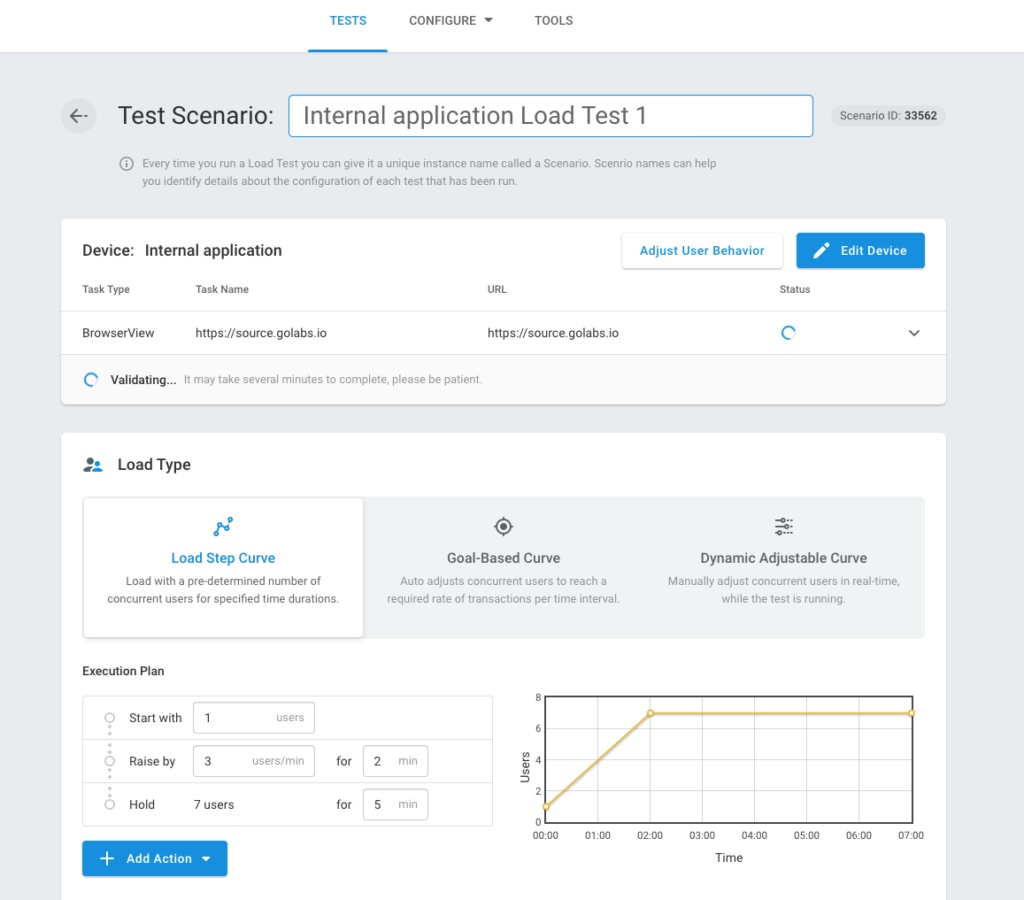
After successfully creating a device, you will see the Test Scenario screen where you can set and define load type, load injector locations, etc. Next, we will select the Load Step Curve option.
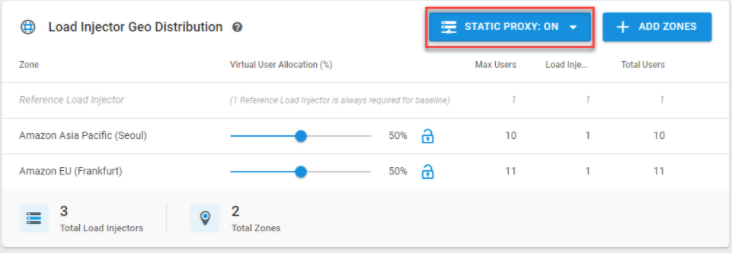
LoadView will begin to verify whether you have access to the internal application. Select Static Proxy and include your whitelisted IPs and select Add Zones to choose the regions where we want the generated traffic. In fact, the LoadView platform can assist with testing web applications, web pages, APIs, and other web services that reside only within your network, behind the firewall.
LoadView users have a few options to select from, such as whitelisting IP addresses or installing an on-premises Agent if organizations cannot open their network to incoming traffic for security reasons. For more information on load testing from behind a firewall, visit our Knowledge Base.
When completed, select Start Test. We need to find Static IPs in the Agent List part from this screen; Load creators for access to internal applications that need to be taken to the whitelist. You can find the static IPs in the Agent List on this screen for access to internal applications that need to be taken to the whitelist.
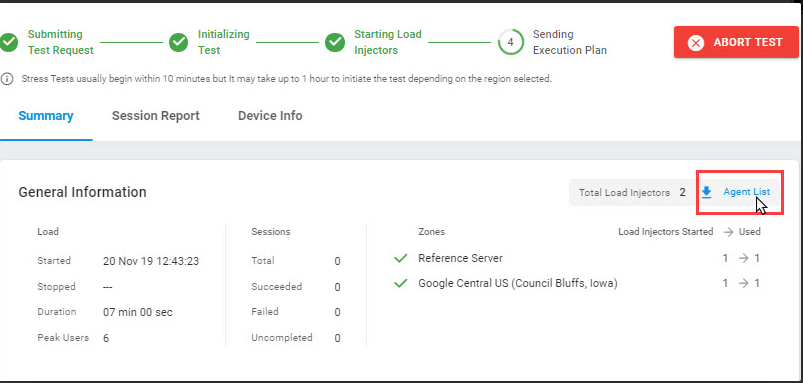
While the test is running, the injectors retrieve new unique IP addresses from the whitelist each time. We can see the performance through panels and graphs of the tests we have created in our application by taking the static IPs in the whitelist. An example is shown below.
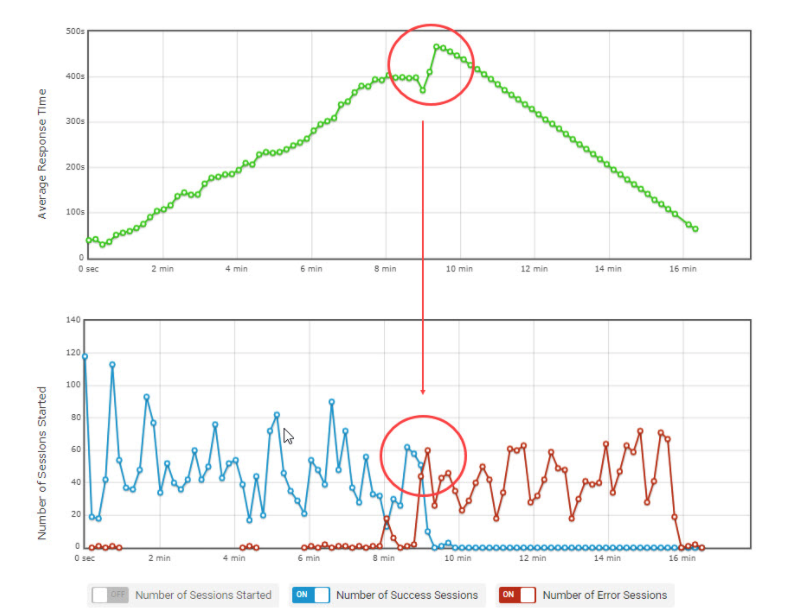
Parallel Average number of users with Average Response time graph.
Monitor Additional Resources in AWS as Load Increases
CloudWatch Metrics
With CloudWatch, we can get statistics about data. We use metrics for check that our system is working as expected. You can create CloudWatch alarm to track a specific metric and receive alarm notifications in your mail. Load balancing only reports data to CloudWatch when requests go through the load balancer and measures Elastic Load Balancing metrics every minute and sends them to CloudWatch.
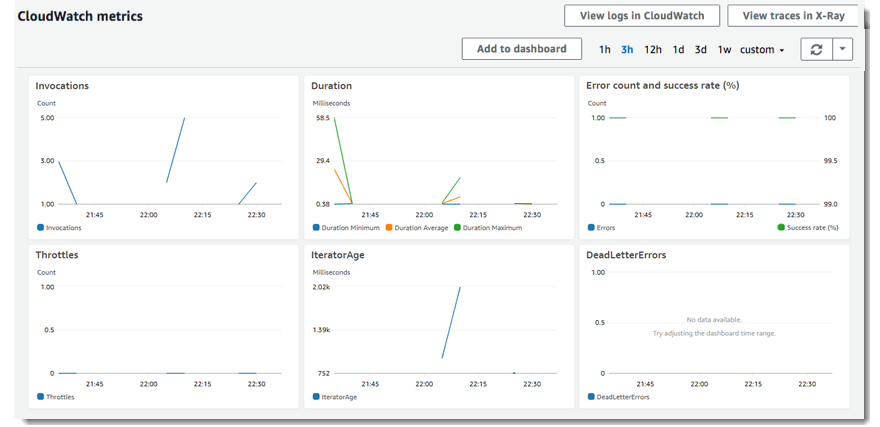
View CloudWatch Metrics to your Load Balancer
You can view the CloudWatch metrics of your load balancers using the EC2 console. If the load balancer is enabled and receiving requests, we can view the data points.
Access Logs
Through access logs, we can analyze traffic and use them to fix our problems. We can also store requests we make to our load balancer in Amazon S3 as log files.
Request Tracing
The load balancer adds a tracking identifier for every request it receives, so you can monitor HTTP requests.
CloudTrail Logs
With CloudTrail, logs of transactions made by all users’ accounts can be followed. In this way, you can manage authorization and access requests.
Ensuring No User Experience Degradation with Auto Scaling
CloudWatch Synthetics let you to monitor user performance. It provides a better overview of performance and usability, so you can detect problems earlier and respond faster, thus increasing customer pleasure and making sure your application can respond better to requests. Canaries are used to let us with early warning. For Canary use, we click on Canaries in the CloudWatch Console where we can observe the status of all canaries on a single screen.
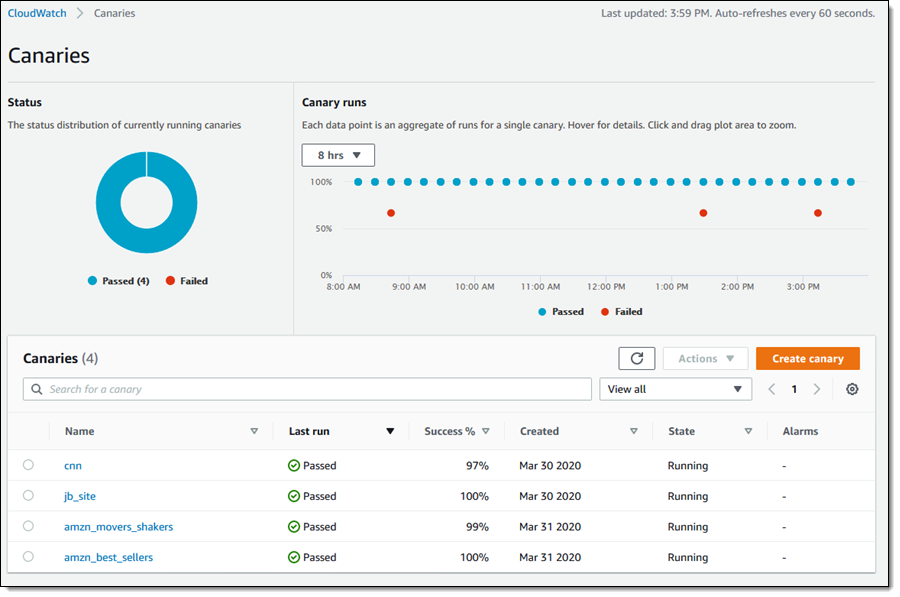
Let’s examine how canaries are performing on the data. For this, when we examine individual data points in the Canary running section, you can see that every datum point is the sum of the studies performed for one canary.
In the screenshot below, you can see that there is a TimeoutError subject for 24 hours. We can also see screenshots obtained with HAR files and logs. Within every HAR record we see the elapsed times for responses and requests and HTTP requests made for Canary.
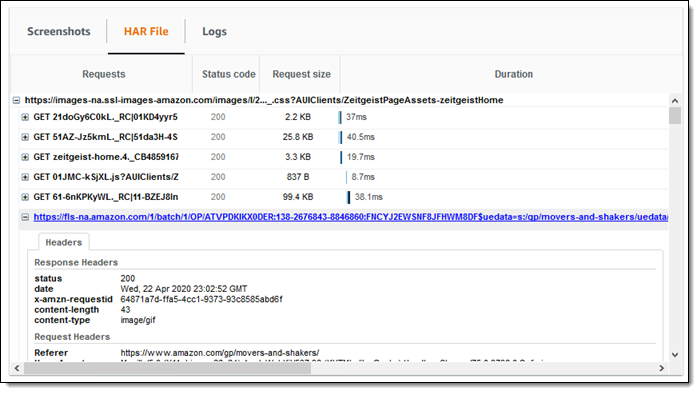
Canary tasks are done using lambda functions. From the Metrics tab you can access the function’s execution metrics.
Hatching a Canary
To create a canary, we press the canary to create it. We can select from the check boxes, load the existing script or import from Amazon S3.
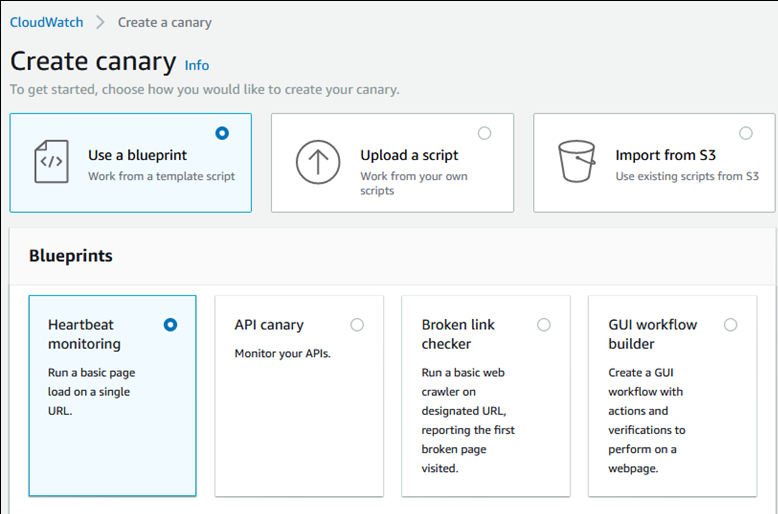
As a result of the methods we create, running script once or run periodically is created. We can use the GET or PUT methods, requested HTTP headers when creating canaries for API endpoints. We can also create our canary build process via GUI. We can easily give our canary features. Canary scripts use the syn-1.0 operation time. You can see the sample script below.
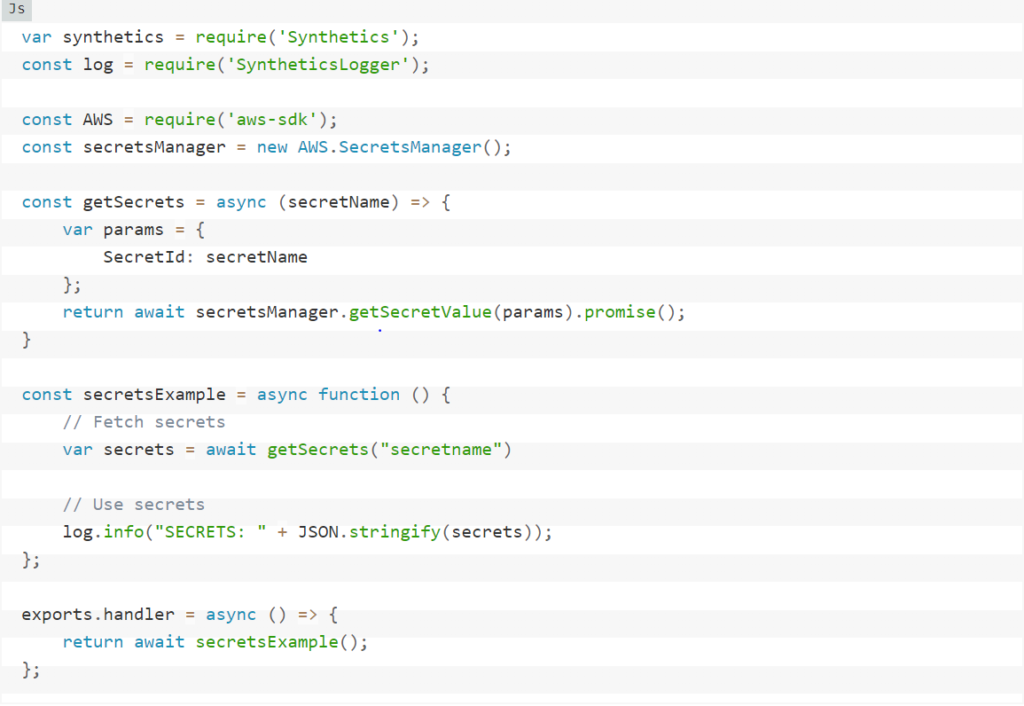
Within the scripts, we can see successful results and errors as exceptions. We create the data retention period for the script. We choose S3 bucket for the structures that will be formed after each work of our canary. During the creation of our canary, we can also set some of the facilities such, as IAM (Identity and Access Management) role, CloudWatch Alarms, VPC (Virtual Private Cloud) Settings, and Tags.
Conclusion: Testing Auto Scaling in AWS
In order to prevent our users from being adversely affected due to degradation, we can use Canary to detect the possible problems before users, log them, and intervene in earlier stage and respond them faster. Moreover, thanks to the alarms provided in our canaries we can increase the sources when needed, which also prevent the users being negatively affected.
Even more, in order to maximize customer satisfaction and make sure that your applications can respond better to requests, CloudWatch Synthetics, combined with the LoadView platform, can help you to get a better overview of performance and usability and ensure that auto scaling is performing as intended during load tests.
Sign up for the LoadView free trial and start performance testing for all your web pages, applications, and APIs today.
Or if you would like to see the LoadView solution in action first, sign up yourself, and anyone else on your team, for a private demo with one of our performance engineers. They will provide a comprehensive demo, covering everything from creating and editing load testing scripts, to configuring and executing the load test scenarios and analyzing reports. Schedule your demo.