Execute large-scale load tests from a fully managed cloud network
Distributed Load Testing on AWS
Distributed load testing on AWS, which is a solution that simulates thousands of concurrent connections to a single endpoint, will be explained. It is very useful tool for anyone iterating on their application development and performance.
What is Being Tested Exactly?
Imagine you are a developer and you have built the world’s greatest application (or maybe it is the greatest application you have ever built). As a developer, you are sure that it works fine since you have done unit and functional testing. What you need to know next is, is this going to perform in production and is it going to perform at scale? Scalability is incredibly important. Load testing applications can be thought of as the same as functional testing, but just applying load to your applications and observing what happens. There is a difference between for testing for one user and testing it for a thousand people is different.
The solution builds out a framework where you can test your applications under load by using Elastic Container Services to spin up containers which create hundreds of connections to your end point and you can spin up hundreds of those containers. The landing page of Distributed Load Testing on AWS is shown below.
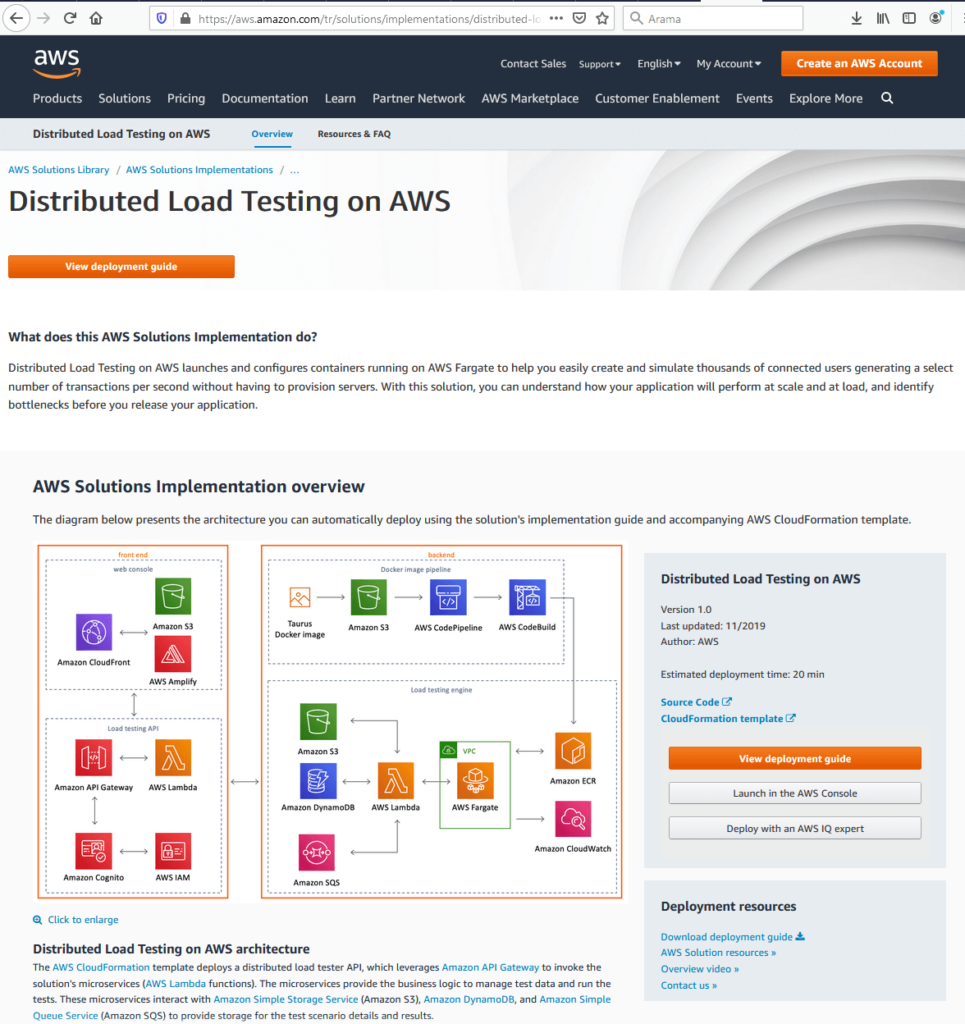
As it is seen from the figure, there is a link to a CloudFormation template which will spin up the solution in the user’s account with a couple of clicks, a detailed deployment guide. The View Deployment Guide is a detailed guide that gives an instruction about the architectural considerations and configuration steps for deploying Distributed Load Testing on AWS in the Amazon Web Services (AWS) Cloud. The source code is available on GitHub if the user wants to take it and customize it for their own needs and requirements. The architecture diagram represents the overall infrastructure of the solution which comprises the front-end and back-end.
AWS Front-End
When front end is considered: there is a web console and a UI which the user can use to interact with the solution. There is also an API, which allows you to create tests, view status of test, re-run test, and delete test operations. UI comes from the CloudFormation template. This is where the users actually start configuring the test itself.
AWS Back-End
the back end comprises of two things: there is a Docker Pipeline and then the actual testing engine itself. Where Docker Pipeline comes from is solution uses an open-source software called Taurus. There is Docker image available on Docker Hub that a user can use. That allows the user to generate hundreds of concurrent connections to an endpoint. It also supports JMeter and Gatling, which are other testing tools. This is the actual testing part of the images and this is the application that is going to do the testing and that comes in the form of a Docker image. Back-end pipeline is going to take that image package up for us and push it out to S3 in the customer’s account. And then CodePipeline and CodeBuild is being used to build that image and register it with Elastic Container Services.
The actual testing is occurring in AWS Fargate. It is a managed service that will let you run your containers on the Elastic Container Service without having to worry about networking or the underlining infrastructure. It is literally just spin up a task, run the number of containers which you want everything else is taken care of. Moreover, we have a Lambda function that will take the requests from our API and that is what is actually running the tests. It will store a test template in S3. It will store all of the information that we are collecting in Dynamo and then we are using SQS to queue up those tasks in AWS Fargate so that we can start spinning up our containers.
Configuring an AWS TEST
Below, there is a presentation about the front end on how we configure a test.
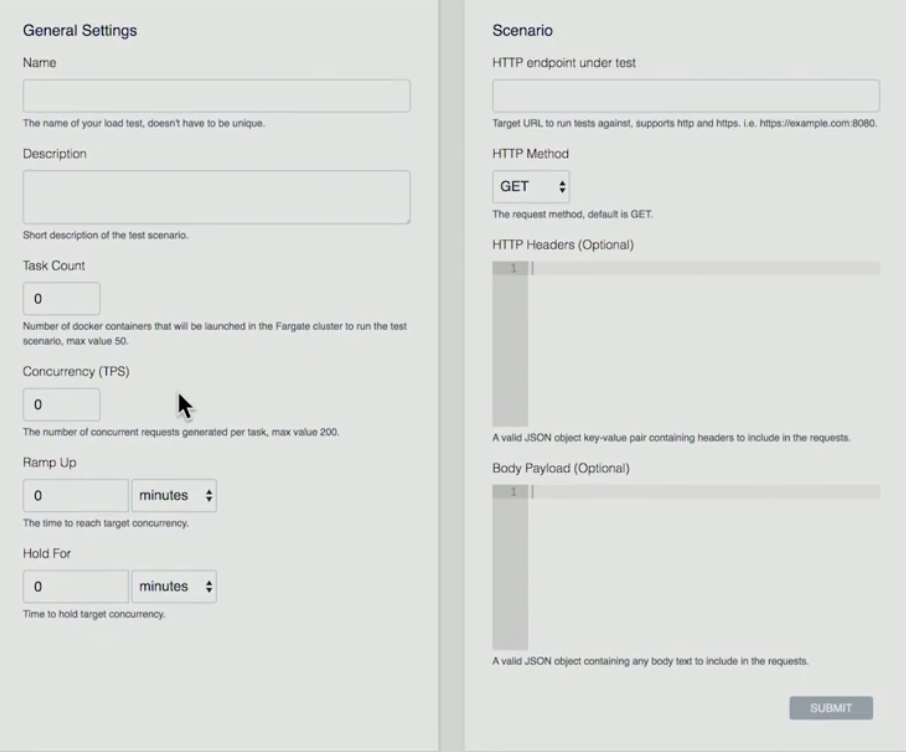
- User hits the button of “Create Test” button
- User gives a Name, Description, Task Count (it is the number of containers what you want to run), Concurrency (it is the number for each container. How many concurrent connections that’s going to create), Ramp Up (how long I am going to get from start to get up to that number of concurrent connections), Hold For (how long am I going to hold that test for?)
- Scenario: HTTP endpoint under test (currently AWS support single end point), HTTP Method (AWS supports GET, PUT, POST, DELETE operations), HTTP Headers, Body Payload (Headers and Payload can be parsed).
Below, a screenshot of a currently test running is provided:
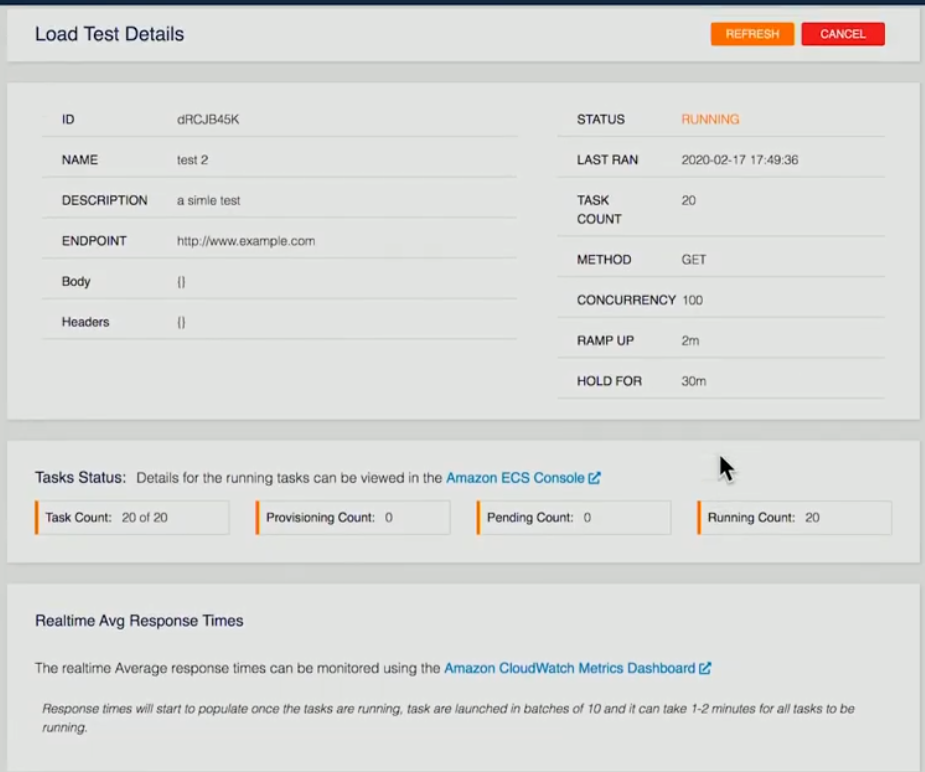
The details of the test have been provided. In this specific example, 20 containers have been asked, 20 containers are running. Once that’s finished on the back end, each of the containers will run the tests, take the results, and then store that in the form of an XML file in S3 of our back-end Lambda function. Once all of the containers have finished, we will take that information and aggregate it, pass all that information into Dynamo.
Below, there are three screenshots of a page which represents the results of the test.
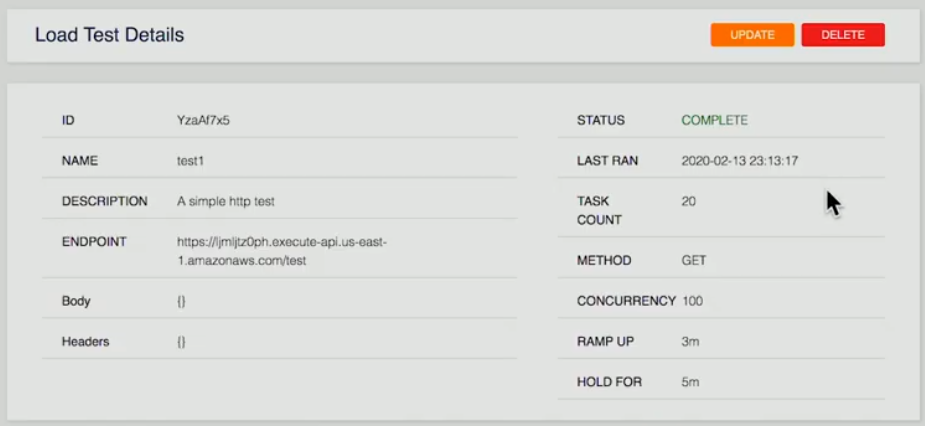
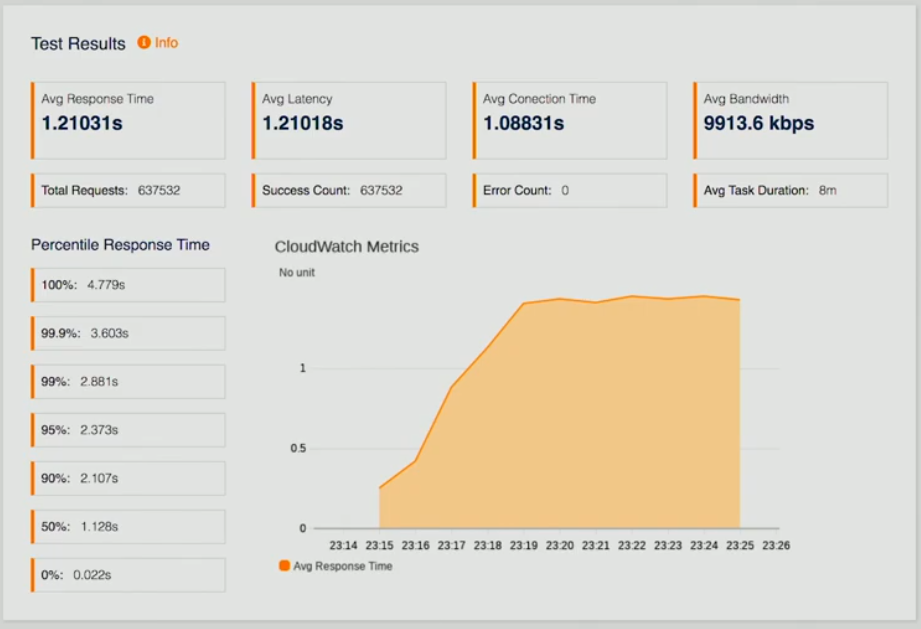

If the user looks at a completed test, they are presented with summary; test results which are average response times, latency, CloudWatch Metrics so we can see how we are performing, a number of other data points, as well as a results history.
Imagine you could run this once, do some fine tuning on your end point on your API and then re-run the test again to see how that improves the response time so that the developers are able to iterate and see their results over time of the improvements for the making to their application. Most importantly, they are seeing performance at scale.
This was a deep dive into distributed load testing on AWS. This solution removes all the complexities of generating load to test your applications at scale.
AWS Autoscaling
Autoscaling is a method used in cloud computing, whereby by a number of computational resources in a server farm, typically measured in terms of the number of active servers, scales automatically based on the load on the farm. AWS Autoscaling helps achieve horizontal scalability of your application. It helps achieve high availability, scale up and down EC2 capacity, maintain the desired capacity, increase/decrease capacity seamlessly based on demand, it leads to cost optimizations. It works with ELP and CloudWatch.
Creating Elastic Load Balancer
The figure below shows the general structure to help understanding the basics.
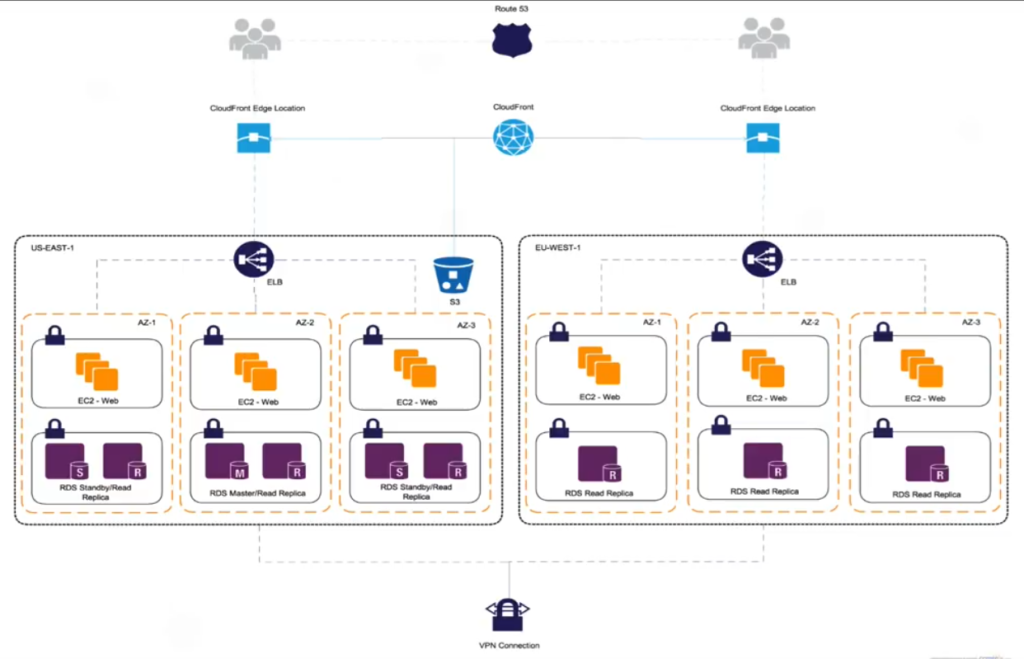
Create Elastic Load Balancer
Before we can create and set up the launch configuration and autoscaling, we need to create our Elastic Load Balancer (ELB) which is a service provider by AWS to distribute incoming traffic evenly across healthy EC2 instances that are under its control. Healthy is the keyword here. The elastic load balancer performs periodic configurable health checks and makes decisions on where to send traffic. The screenshot below is a heading to EC2 dashboard.
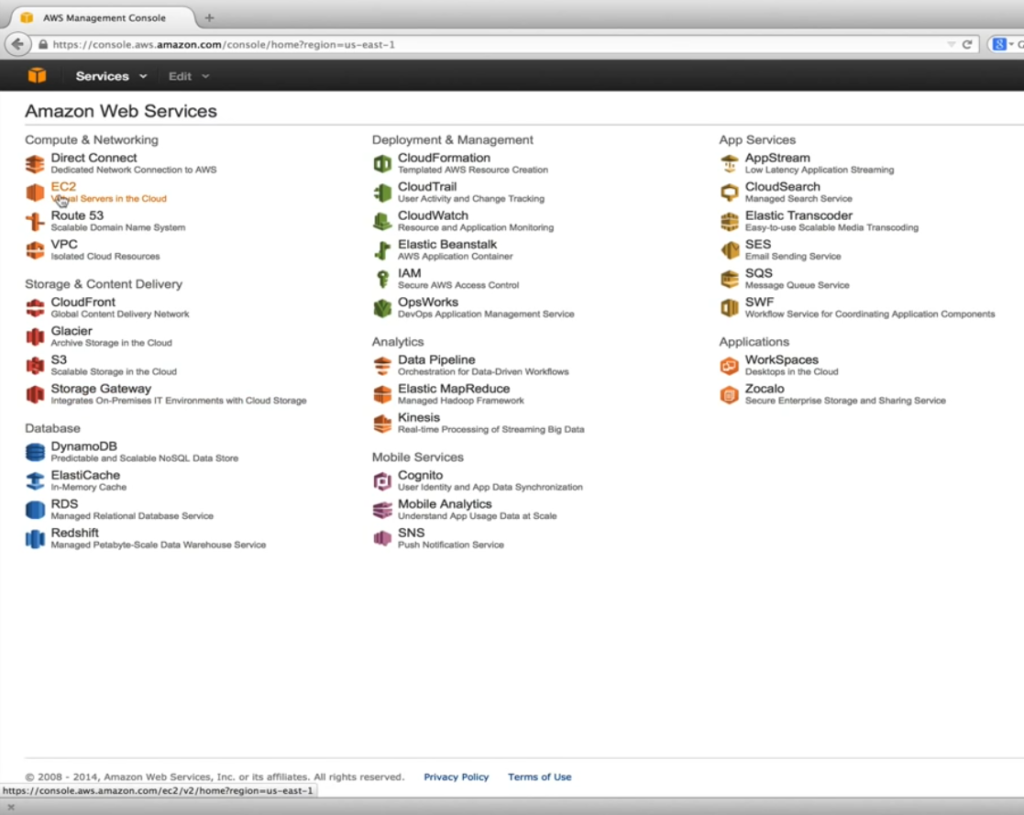
Here our aim is to go for EC2 virtual servers in the cloud. As it is shown below, under Network & Security, we select Load Balancers.
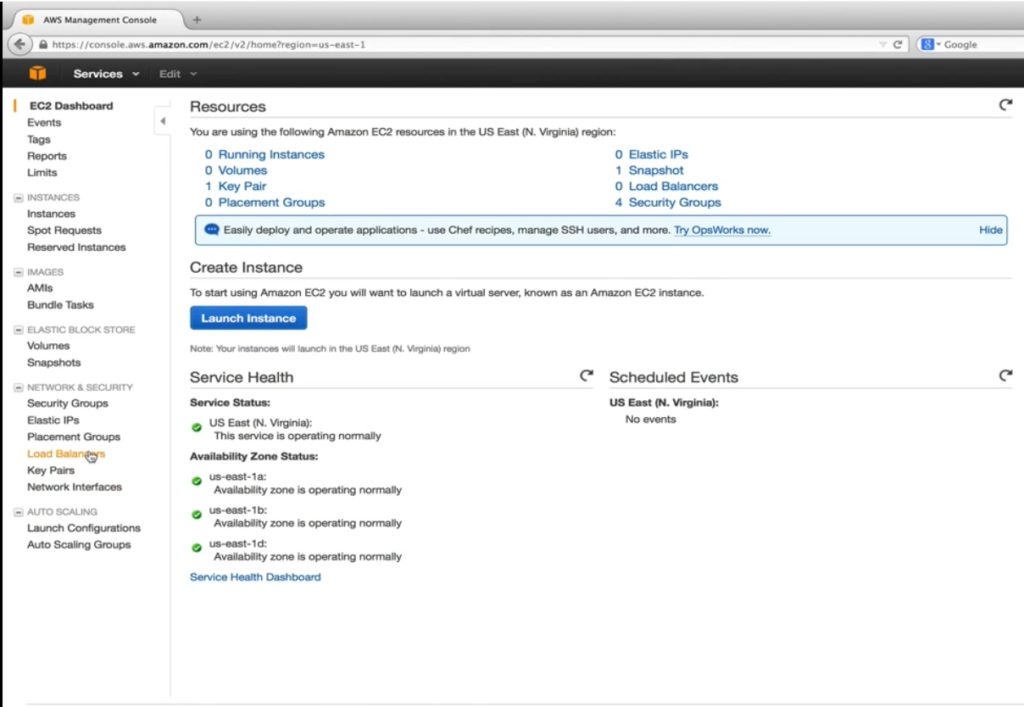
After that, the user hits the button of Create Load Balancer button.
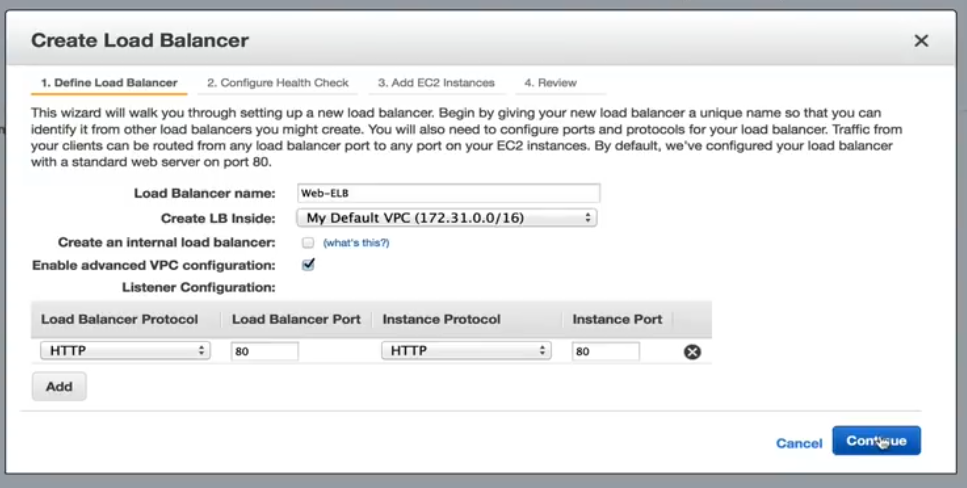
The user gives a name. In this specific example, we leave Create an internal load balancer unchecked. This will direct the DNS name to a public IP address. If checked, the DNS name will be a pointed to a private IP instead. Enable advanced VPC configuration will be checked which will let us assign subnets to ELB in a later step. The listener configuration allows us to map incoming ELB traffic to EC2 instances ports. The default port 80 mapping helps to our application.
Configure Health Check
The next step, which is shown below, is to Configure Health Check.
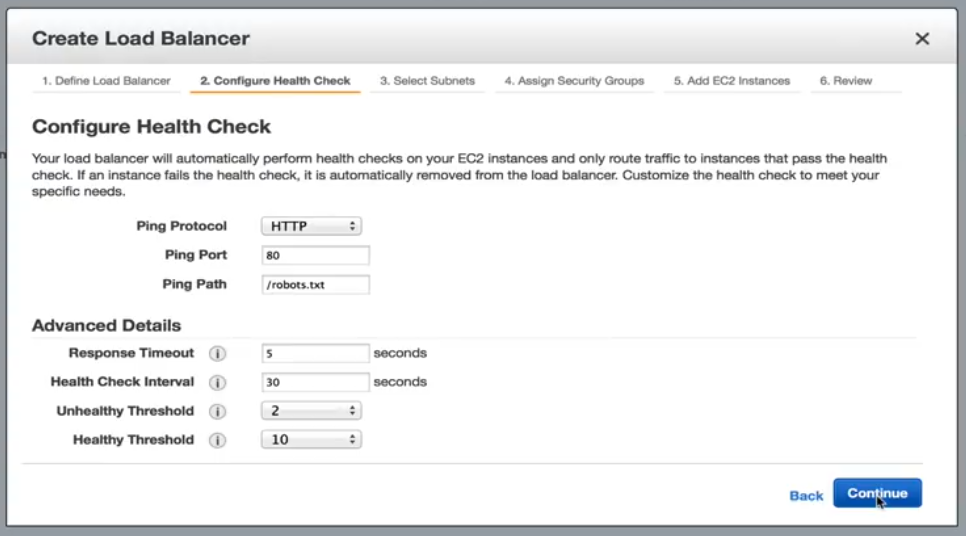
Configure Health Check: Options
In here, our options include standard HTTP, TCP, HTTPS and SSL. In our example, we will stick into HTTP and directed to robots.txt file. If our web server cannot serve up to static request, then we can safely assume something is wrong with the instance and no further traffic should be sent to it until it becomes healthy. With the current settings under advanced details, an EC2 instance will be checked every 30 seconds. It has 5 seconds to respond the request. Failure to respond in the allocated time means the instance could be unhealthy. Two consecutive unhealthy checks will put the EC2 instances out of service status. To become healthy again. It must pass 10 consecutive health checks before it will begin receiving traffic. These thresholds are acceptable for our application.
Select Subnets/Zones
Select from the Subnet options shows below.
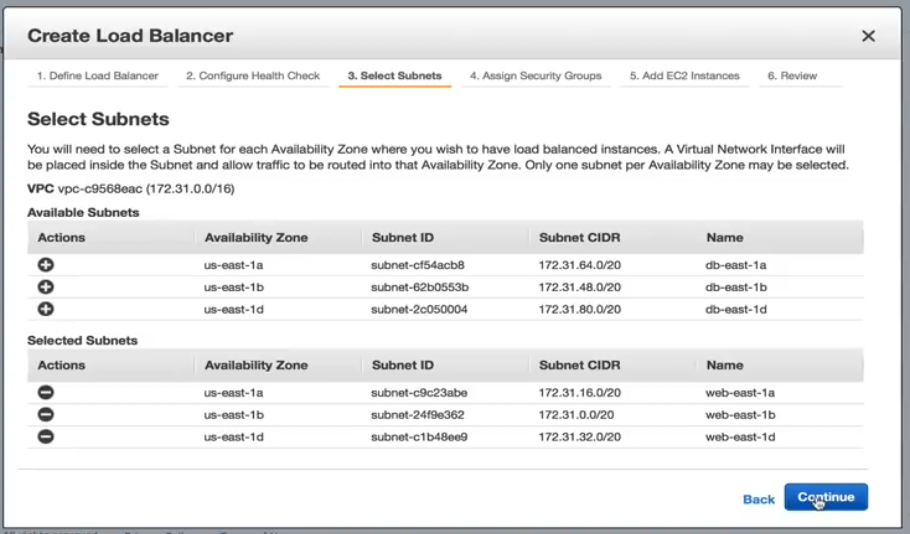
We will add each subnet we created for our web servers. It is important to mention that we can only add one subnet per availability zone.
Assigning Security Groups
Below is a screenshot of what assigning security groups looks like.
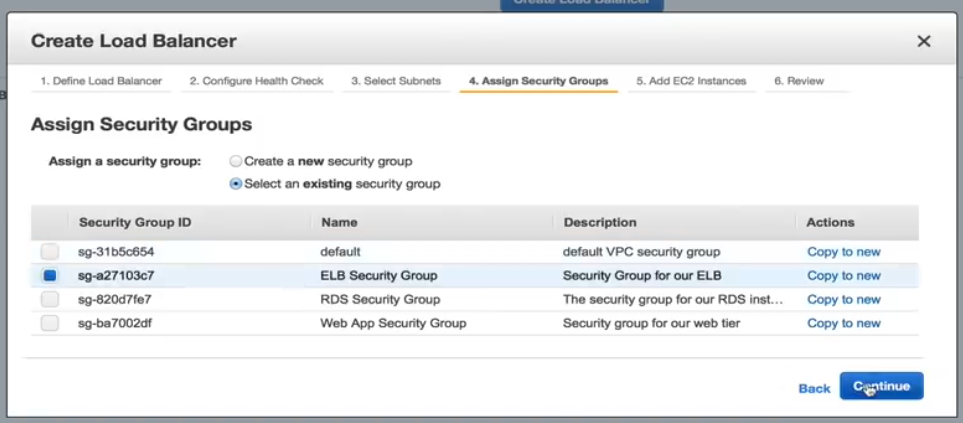
We need to select a security group for our ELB, so for this example, we will select the pre-configured ELB security group.
Adding EC2 Instances
Below is a screenshot showing how to add EC2 instances.
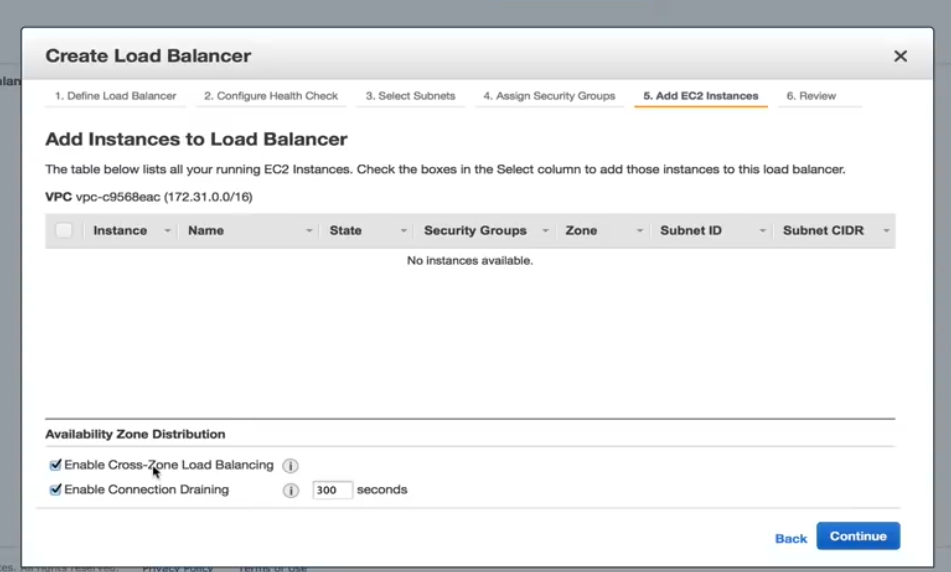
In this step, we need to ensure that the Enable Cross Zone load balancing is checked. Without it, our high availability design is useless. Enable Connection Draining should be also checked which determines how traffic is handled when an instance is being unregistered or has been declared unhealthy.
Create Load Balancer Review Page
The Review page is shown below. From here you can review your selections and make any additional changes, if needed.
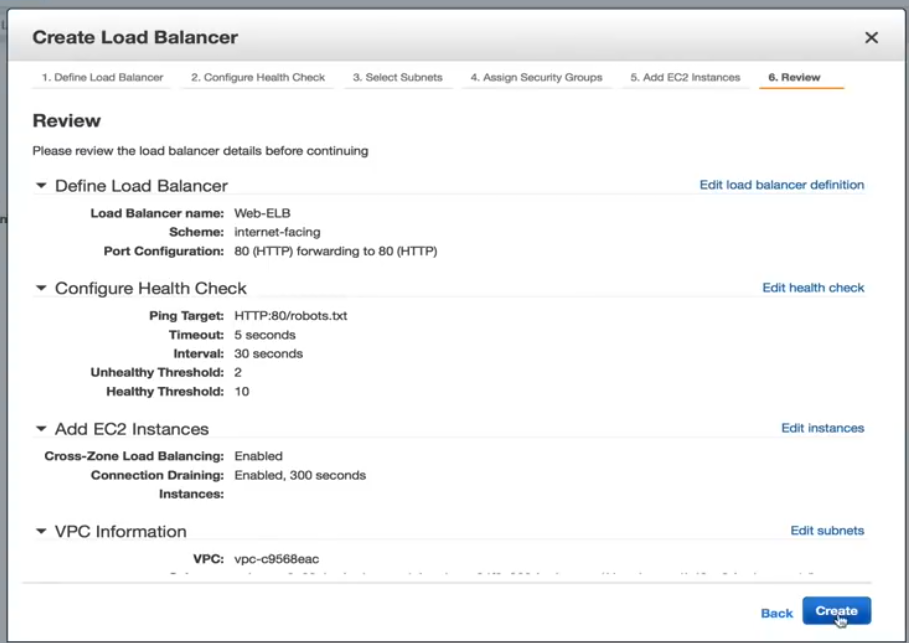
Now, the ELB is created. Once it is finished, we are ready to create our launch configuration an autoscaling policy. Creating the autoscaling policy is also easy, therefore, a user can go through the process themselves.
LoadView Versus the Competition: Why LoadView Stands Out
This section provides high-level comparisons between other popular load testing tools and solutions and LoadView. Not all load testing tools are created equal. Even though open-source tools don’t usually require upfront costs and investments, which may make them an easy option to use, it is best to understand what makes LoadView easier to use than other tools.
Apache JMeter
Apache JMeter, which is an open-source software, is for load testing functional behavior and measuring performance of the web applications. Next, we’ll take a highlight the pros and cons of JMeter.
Apache JMeter Advantages
- Platform independent. JMeter can run in any operating system like Mac, Windows, and Linux.
- Open-source. The tool is open-source, meaning it can be used free of charge. A software developer can also make modifications and configure it to their requirements, which leads to a lot of flexibility. A developer can customize JMeter, apply automation testing to JMeter.
- Functionality. With JMeter, a user can do any kind of testing they want – load tests, stress tests, functional tests, distributed tests, etc.
- Reporting. JMeter provides numerous reports and charts – Chart, Graph, and Tree view. Moreover, HTML, JSON, and XML formats for reporting is supported.
- Support for many Protocols. JMeter supports FTP, HTTP, LDAP, SOAP, JDBC, and JMS.
- Load Generation Capacity. The software has an unlimited load generation capacity.
- Execution. It is easy to execute. The user just needs to install Java, download JMeter and upload the JMeter script file.
Analysis Report. Results are easy to understand for less experienced engineers & users, and also allow in-depth analysis for testers.
Apache JMeter Disadvantages
- Not Being User Friendly. You have to write lots of scripts, so it is as not user friendly as other tools. It can be confusing. To be able to perform testing, the user needs to write scripts which can be hard, confusing, it leads the software not being user friendly.
- Lack of Support for Desktop Applications. JMeter is ideal for testing web applications, however it isn’t great for desktop applications tests.
- Memory Consumption. JMeter is able to simulate heavy load, visualize the test report which absorbs lots of memory, leads the memory being under big load.
- No JavaScript Support. JMeter isn’t a browser, so it only behaves, or simulates, a real browser. It doesn’t support AJAX and JavaScript, so this affects the efficiency of the test. You aren’t able to properly gauge the client-side performance (for more information on JMeter pros and cons, check out our Ultimate Guide Performance Testing with JMeter)
LoadNinja
LoadNinja is the load testing platform in the cloud allowing you to reliably determine your websites and web application’s performance without using any scripts. LoadNinja has been built and designed from the ground up to the media the challenges faced by conventional protocol-based load testing tools. We’ll discuss some of the highlights and limitations of LoadNinja.
LoadNinja Advantages
- Uses real browsers
- Browser based metrics with analytics and reporting features.
- VU Debugger. Allows developers to find and isolate errors during the test.
- VU Inspector. Gives users insight into how virtual users interact with their web pages and applications while the test is running.
- Recording tool. Similar to the EveryStep Web Recorder, which we will cover in more detail below, allows for point and click scripting.
LoadNinja Disadvantages
- Dependent on AJAX. Doesn’t work if JavaScript is disabled or not supported.
- Dynamic content. Dynamic content won’t be made visible for your AJAX-based application.
- Latency. Latency issues can be higher, just based on the asynchronous behavior of AJAX.
- Cost. Can be pricey, compared to other tools in the market and features included.
LoadRunner
It is a software testing tool from Micro Focus. It is used to test applications, measuring system behavior, and performance under load. It can simulate thousands of users concurrently using application software. Let’s take a quick look at what makes LoadRunner popular and some of the disadvantages of the solution.
Advantages of LoadRunner
- Replay and record functionality (in addition to automated correlation).
- Variety of protocols are supported in addition to proprietary ones like Remote Desktop, Citrix, and Mainframes.
- The software can attempt to perform automated analysis of the bottleneck.
- Integration with infrastructure like HP ALM, QTP.
The software can monitor itself and the application under test in terms of resources availability (RAM, CPU, etc.).
Disadvantages of LoadRunner
- LoadRunner is an expensive software testing tool. It has recently released free trial versions however it cannot be simply downloaded for use.
- LoadRunner has a limited load generation capacity. The user cannot overload LoadRunner tool with too many users or threads. (If the user is looking for performance testing tool which will perform heavy testing and also too many users and thread groups, then LoadRunner would not be the best choice).
- Execution is complex. It creates one thread for each user.
- In terms of Analysis Report, the information in a raw format which is parsed by HP Analysis to generate various graphs.
LoadView
The software is a cloud-based stress and load testing tool for web pages, web apps, APIs, and even streaming media. Since LoadView is cloud-based, engineers and testers can quickly spin up and scale load tests depending on their load requirements. A user can produce as much traffic as is requested. In this process, the user does not need to handle additional infrastructure, which is huge advantage over open-source tools like JMeter, which requires users to run tests from their own machines, and cannot scale to the level that LoadView offers Moreover, the software generates a sequence of HTTP GET/POST request to test web servers and web APIs.
LoadView Advantages
- No long-term pricing obligations, comes with a pay-as-you-go pricing model, so customers can load test whenever they need to.
- Supports recording user scenarios for dynamic and Rich Internet Applications (RIAs), such as Java, HTML5, Flash, Vue, Angular, React, PHP, Silverlight, and Ruby (among many others) are supported. If it can be rendered in a user’s browser, the EveryStep Web Recorder supports it.
- Users can utilize servers from numerous global geographical locations to mimic the expected user base.
- Creating load test scripts without even having to touch a line of code.
- Cloud-based load testing in real browsers.
- Test compatibility on over 40 desktop/mobile devices and browsers.
- More than 20 world-wide load injector geo-locations.
- Diagnose bottlenecks, assure scalability, and determine overall performance.
- Performance reports, metrics for capacity planning, performance dashboards, and more.
Summarizing this section, it is shown that LoadView is easier to use, more efficient than the other remaining tools which we covered.
Wrapping Up: AWS Load Testing – Load Balancing & Best Practices
In this article we covered how to carry out distributed load testing with AWS, which clears away all the intricacy of generating load to test your applications at scale. AWS load testing is used to aid users to build and reproduce thousands of connected users achieving number of transactions. We also covered the autoscaling feature within AWS, including definitions of autoscaling, how to create elastic load balancers to launch configuration, and setting up autoscaling. We also took a look at some of the other popular load testing tools in the market and why LoadView is much easier to use than other tools.
For a deeper look at LoadView compared to other load testing tools and solutions in the market today, please visit our Alternatives page for comprehensive side by side comparisons and information.
Get started with LoadView today! Sign up for the free trial and get free load tests when you start.