Execute large-scale load tests from a fully managed cloud network
How do you load test using Gatling?
Is Gatling better than JMeter?
Is Gatling good for performance testing?
Which tool is best for load testing?
Which language is used in Gatling?
What is Gatling?
Gatling is a load testing tool which can be used for your integrated development environment, version control systems and continuous integration solutions. It does not have its own solution, rather it integrates with your existing solutions. It is built on top of Akka, which is a toolkit for building distributed message driven applications. It is a distributed framework which will allow for fully asynchronous computing. It is a small entity within code communicating with each other through messaging.
Using this mode Gatling can simulate multiple virtual users with a single thread. Akka override the JVM limitation of handling many threads. To perform load testing you do not need to know anything about Akka or Scala. But if you want master in Gatling, you should learn at least Scala. Anyways, it is good to have a basic understanding of the technology behind Gatling. It is lightweight and can run thousands of virtual users on a single machine compare to other performance testing tools. It is always good to use a code base performance testing tool like Gatling over JMeter/LoadRunner. Also, you can show off your coding skills. This will give you high flexibility for writing various logic for performance requirements.
Gatling Key Features
There are lot unique features which Gatling offers compare to other performance testing tools in the market today. For the purposes of this article, we will cover a few of the key features and benefits of Gatling.
Scala-based Platform
Although Gatling is Scala-based, you can use the tool without any actual Scala programming experience. Many of Scala’s design decisions are aimed to address criticisms of Java programming language. As I said earlier, if you can learn basic Scala programming knowledge then you can make your tests even more flexible. The beauty of the tool is that you have access to all the benefits of Scala and Java.
HTTP Protocol
Gatling also works based on the applications API for performance testing. You can directly configure API and can instantly execute performance tests.
Gatling Recorder
Gatling comes with a built-in script recorder, just like JMeter/LoadRunner offers. The recorder will intercept the communication between your browser and server. This is also known as proxy recording. You can also use HAR files for making the script, which you cannot see in other tools like JMeter or load runner. In the following sections, we will go through the step-by-step process to do the same.
Continuous Integration
Gatling can be integrated easily as part of continuous integration. It also provides step-by-step tutorials.
Why Gatling?
Gatling is fantastic tool when you just want to load/stress test your system without worrying much about other performance requirements. From a single JVM you can make several thousand concurrent users. There is no requirement to set up a distributed network of machines to do testing. As mentioned earlier, Gatling makes as great tool to add as part of your continuous integration. It is also great if you want to write your own code instead of simply recording the scripts.
Now that we have some basic overview of Gatling use cases and features, we will see how to download and install it. Also, we will walk you through the step-by step-process of recording scripts. Later in this article, we will introduce the LoadView platform, which we feel goes above and beyond what Gatling offers when it comes to meaningful performance testing and engineering.
Gatling Installation and Sample Script Execution
You can download Gatling simply by visiting official website. Step-by-step procedures for installation and sample script execution is provided below.
Installing Gatling from Website
First things first, let’s go ahead and download Gatling from their website.
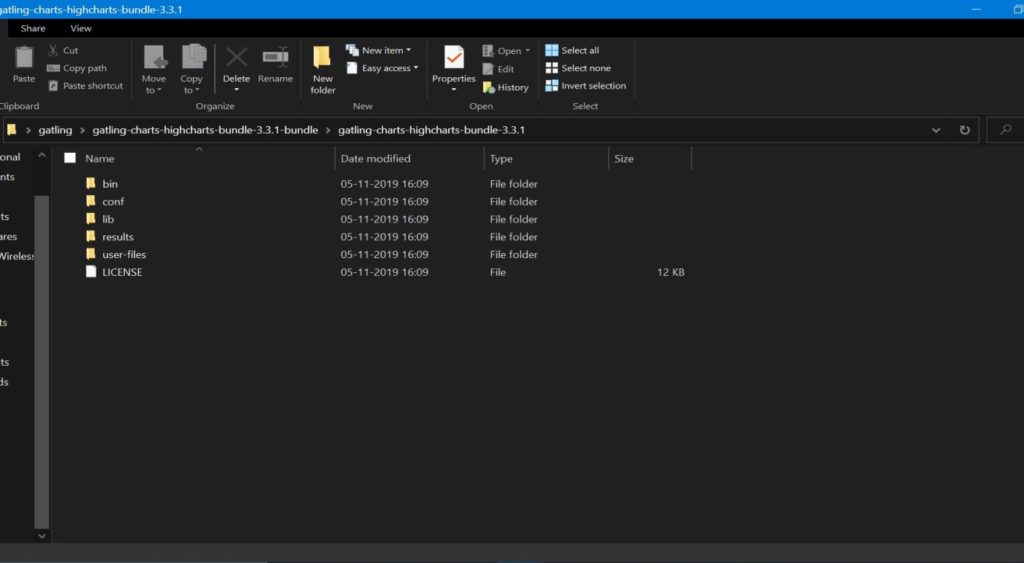
Once you access the above website, you can download the Gatling performance testing tool. Here you have two options for download. Their Enterprise version has more features which we will need to pay for. So, for the purposes of this article, we will go with the open-source version for demo purpose. Once you click on the ‘open-source version’, the open-source version will start to download. Once your download is complete go ahead and unzip the folder. Everything you need to run it is inside that folder.
Gatling Tutorials and Installation Requirements
Gatling also provides good learning tutorials. Learn more about official Gatling tutorials. There are also some separate Windows and Mac installation prerequisites for Gatling. For the basic version to run, you need to have a JDK installed. Also, the tool requires at least JDK8. Learn more JDK8 and installation requirements.
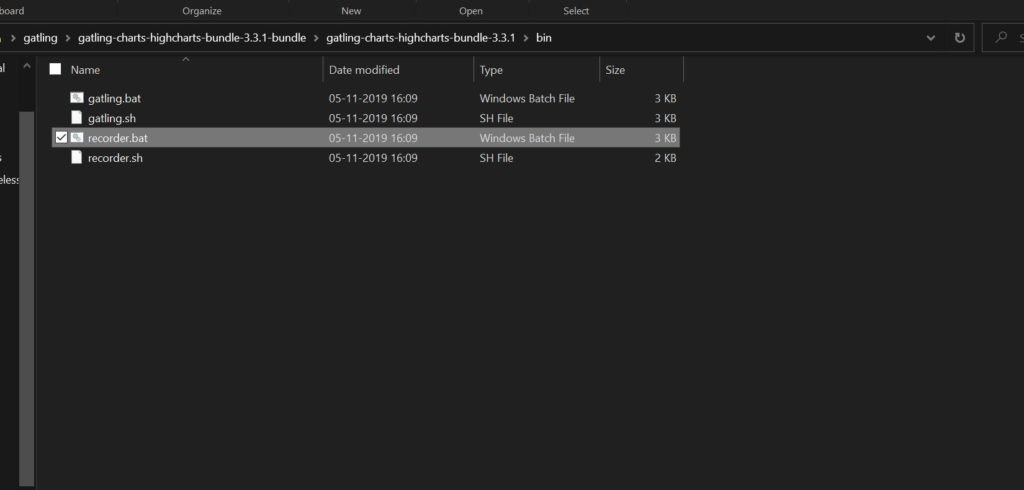
Once you have gone through official Gatling documentation and set your environment with the required prerequisites, we will start the installation. Open the unzipped Gatling folder and go to the bin folder. From here we need to run Gatling. You can do this either from CMD or by browsing to the folder.
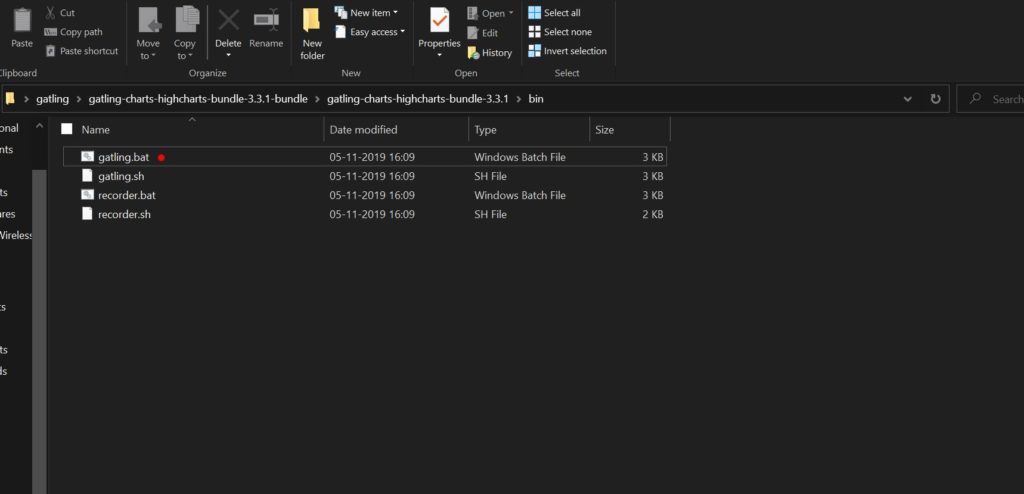
If you are a Mac user, you could run with Gatling.sh. Since we are using Windows, we will use Gatling.bat. Once you double-click on Gatling.bat, the tool will start up and run. Gatling also includes a few example scripts that we can execute. Those scripts will be presented in the example section of downloaded folder.
Gatling Sample Script Execution
Once you double click on Gatling.bat, your Gatling will start up. You will get Gatling execution screen with number of default scripts shipping along with Gatling package.
Next, we are going to choose script [0] – Computer database.BasicSimulation, which is the computer database basic simulation. These scripts are targeted to the Gatling test site. Go ahead and type ‘0’ and press Enter. Gatling will ask you for to enter test description, you can give any valid description for your test.
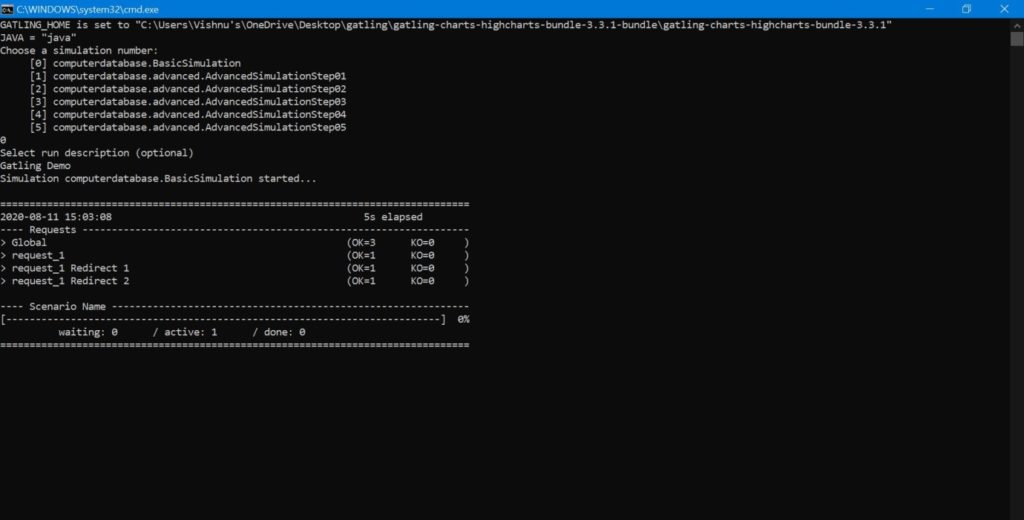
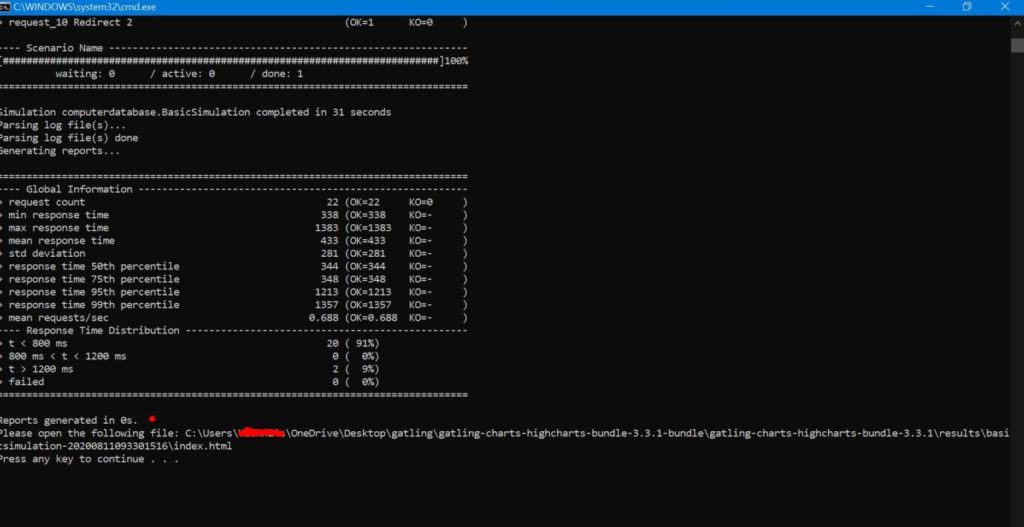
Your execution will start instantly. Every five seconds or so, we will see output to the console. You can see you script ran for few minutes. After the execution, you will also get a success message saying Report is generated in the specific location.
Test Results
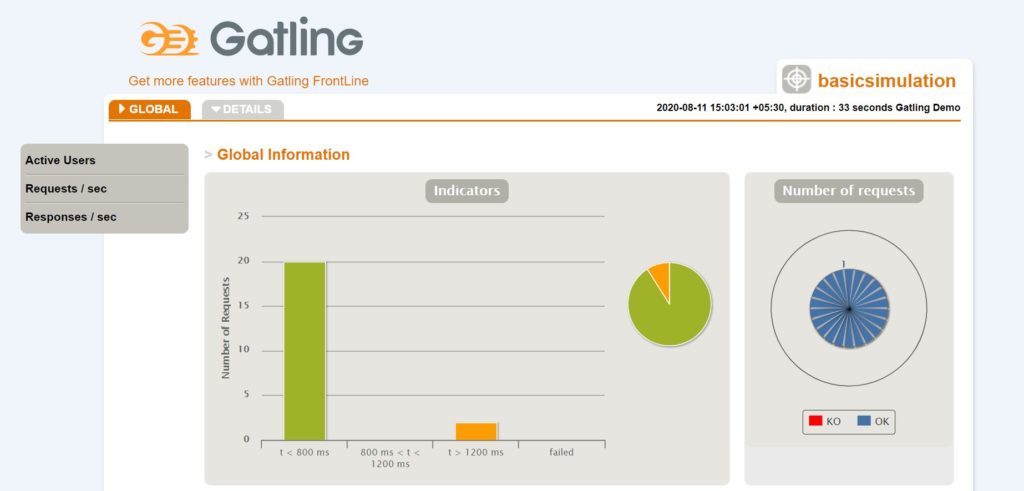
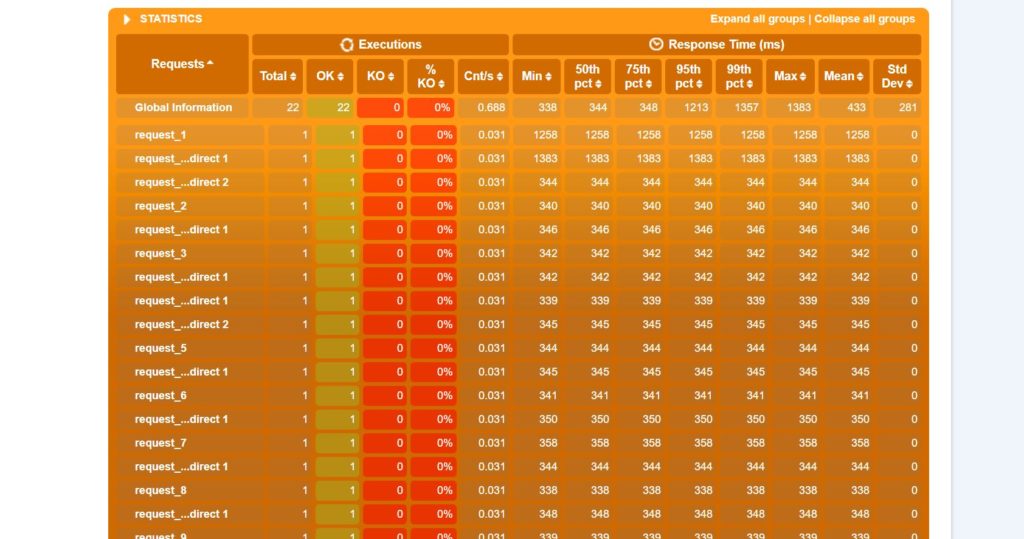
We are not getting into detailed report analysis at this point. If you are familiar with other performance testing reports, this will be piece of cake. We can see a test report has been produced in the mentioned location. I have included sample screenshots of the Gatling report below. Yes, those are HTML reports, and you can further modify the Gatling configuration for report generation format.
Global Information Results
Gatling Statics Report
Congratulations! You have now downloaded Gatling and just run your first script.
Recording Using the Gatling Recorder
Here we are going to see how the Gatling recorder works and how it can help us record the scenarios. There are two main ways to create performance test scripts in Gatling either from writing up the code
Gatling Recorder
Gatling recorder is a GUI-based HTTP proxy recorder. This will help users to simply record a scenario and do the testing.
Manual Scripting
You need extensive knowledge of Scala for writing scripts.
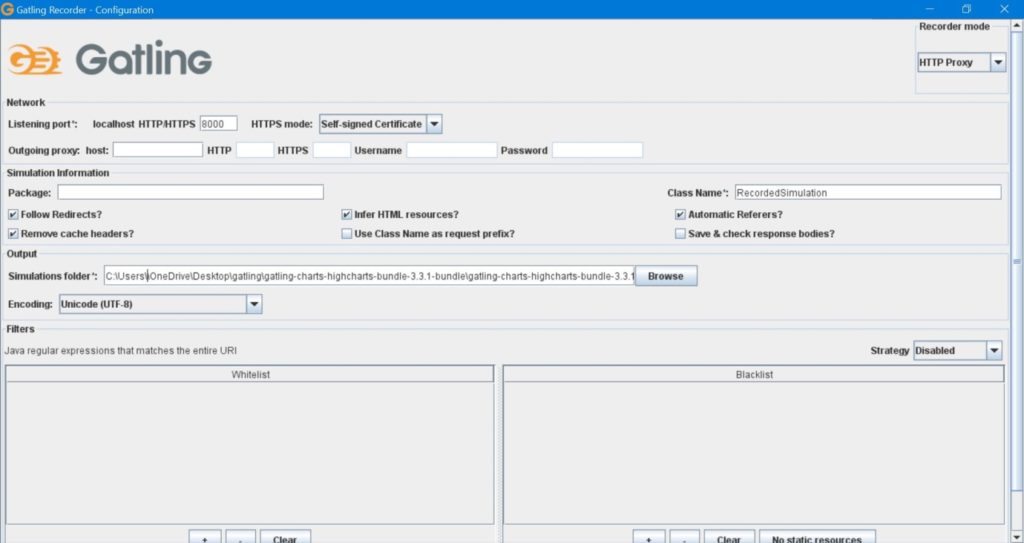
For the purposes of this, article, we are going to show a demo of the Gatling recorder. The Gatling recorder is useful for getting a quick, basic script in place, especially if you are a first-time user of Gatling. To start the Gatling recorder, browse to the Gatling bin directory and run the recorder.bat for Windows and recorder.sh for Mac/Linux.
Once you run the Gatling recorder, you will see the below screen.
Recording Modes
Let us discuss some of the Gatling recorder options. There are two recording modes in Gatling.
HTTP Proxy Mode
HTTP Proxy mode which captures all the traffic from your browser for a proxy
HAR Converter
HAR Converter which converts an HTTP archive file.
The HAR Converter is preferred since it gives you more control and has a lot less overhead with the recording setup. It is also much easier to set up for HTTPS websites. Ultimately, it is your preference, depending on your level of expertise. Or better yet, you can try both options and can then choose the one that you like best or the one that better suits your needs.
There are a few other options we can change here, are marked as yellow below. We can configure whether to follow redirects, output folder, remove cache headers, etc. For now, let us keep all the other options as default.
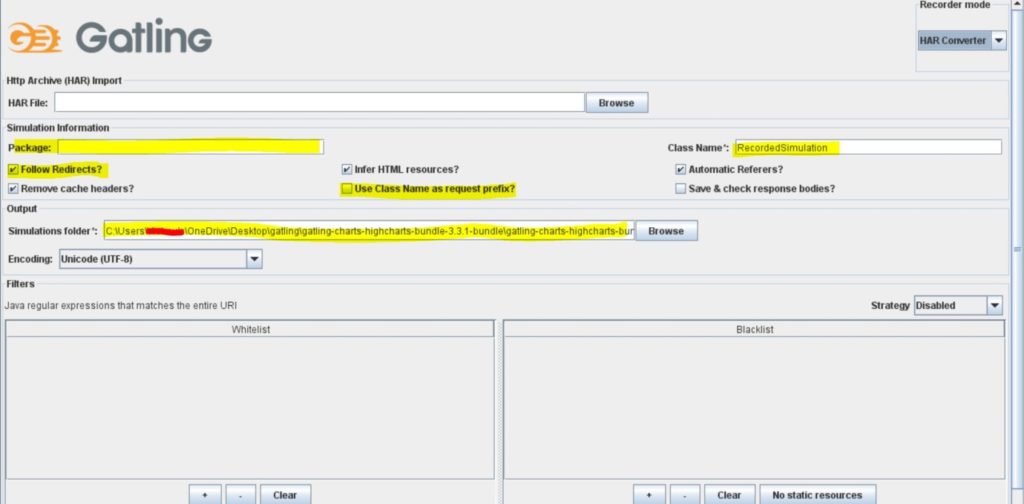
Generate the HAR File for Gatling Recorder
There are multiple ways which we can generate HAR file. Everyone knows how we can do that with the Google Chrome Developer Tool. Here, we are going to show you how you can do that with Fiddler. If you do not know Fiddler, Fiddler is network sniffling tool where you can capture request and response of client-server communications. Fiddler is more suitable for our needs since we can modify our request. Also, we can add/delete unwanted requests from HAR file.
Convert HAR File to Gatling Script Using Recorder
Now, we are going to show how we can create and HTTP archive file (HAR file) using Fiddler. For demo purposes, I will be using the LoadView website.
Important note: Please do not execute performance test against websites without their consent. You can download fiddler here. Installation and setup is a very straightforward process. Once you have downloaded and installed Fiddler, launch Fiddler from your desktop.
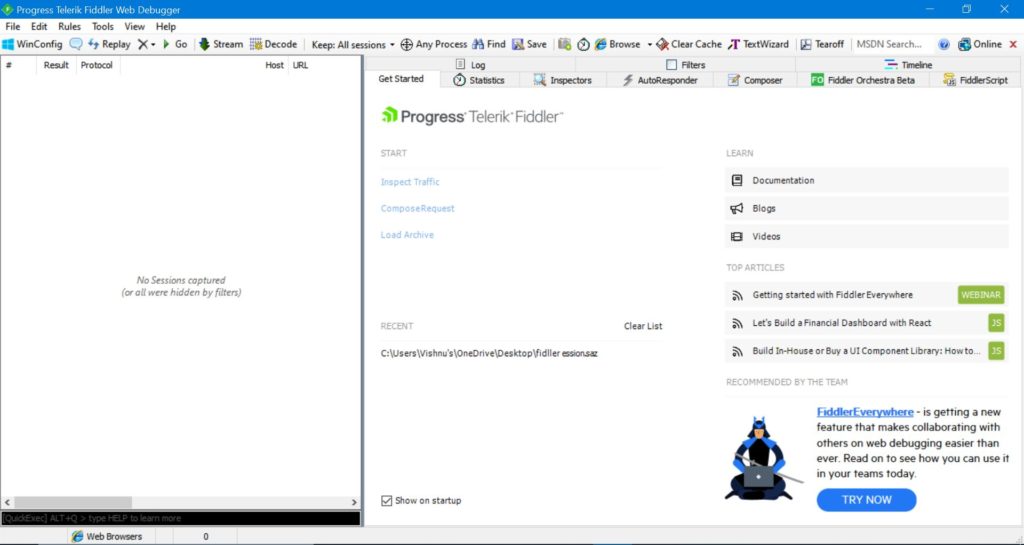
Here, we have configured Fiddler to record only web browsers and HTTP traffic. You can enable network capturing by clicking next to web browsers. You can also learn about the additional Fiddler recording options that are available.
Record Your Scenario
Now you can start record the scenario you need to do performance testing by accessing it in any browser. We are going to navigate to the LoadView website and click on About Us.
As the page loads in the browser, at the same time you can see that getting captured in Fiddler.
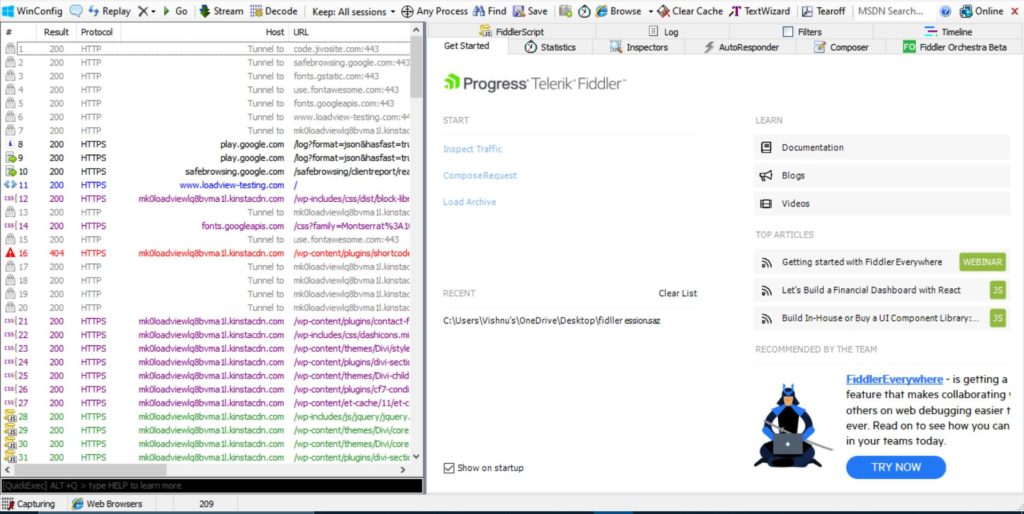
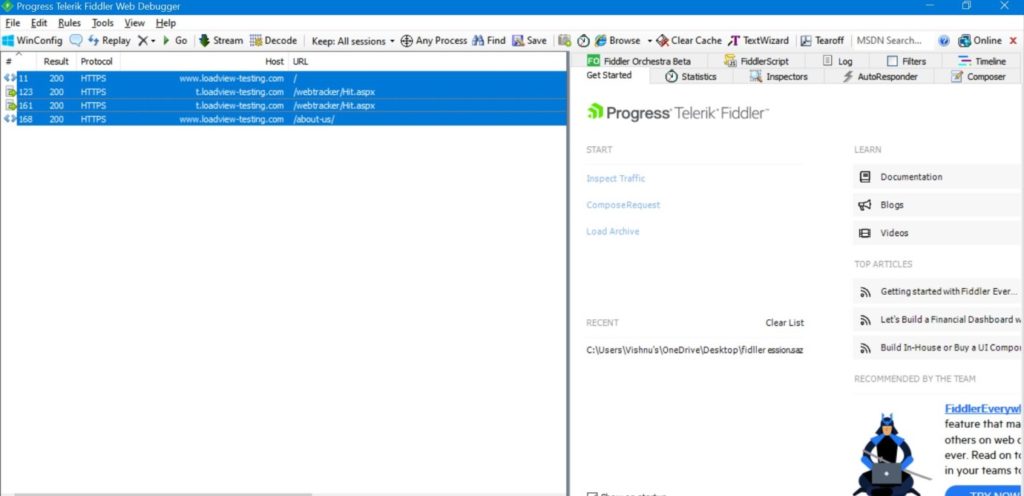
Once you have captured your scenario, stop recording and do search by LoadView and delete all other requests. We need only request with loadview-testing.com.
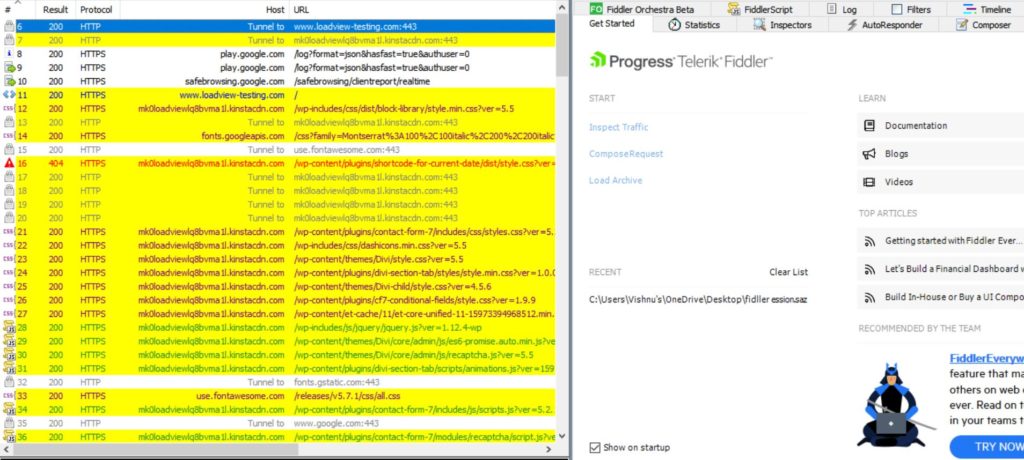
Fiddler Requests
We have removed all the “junk” requests and kept only requests which we needed. You can remove that tracker request as well.
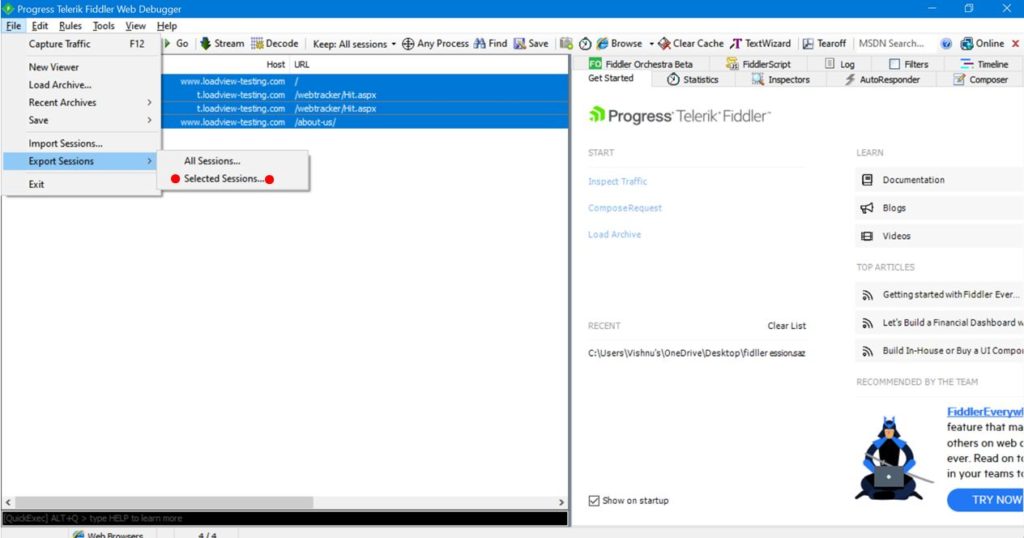
Next, go to File>>Export Sessions and save the request as HTTP archive V1.2

We are done with half of the work. If you are using Google Chrome for creating your HAR file, it will be very tough to clean unwanted requests. That is the reason we have suggested to use Fiddler in this case.
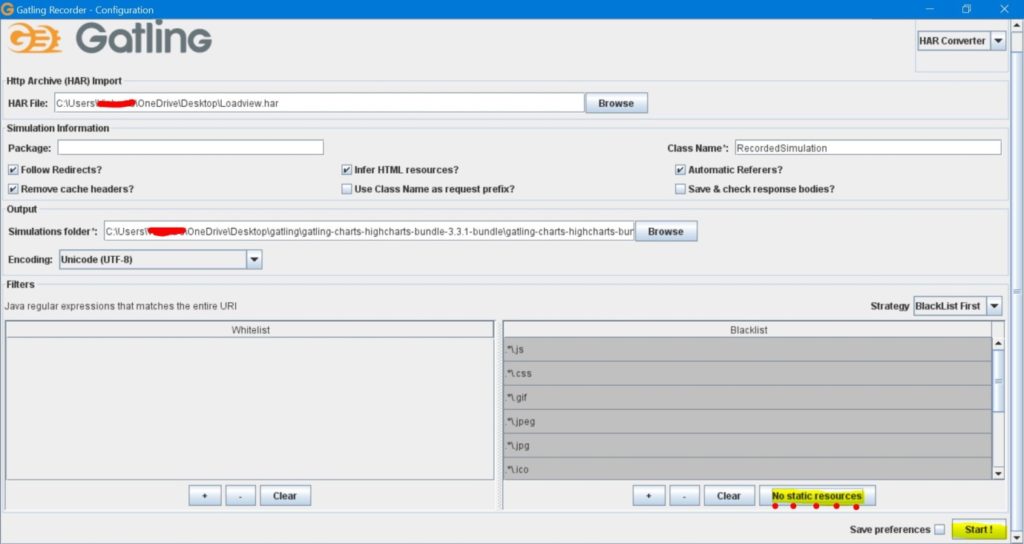
Now, open Gatling recorder and browse to the Gatling bin directory. Double-click Launch Gatling Recorder. Change the recorder mode to HAR converter. Next, browse to the HAR file that we just saved. There is an option to blacklist images, CSS, etc., from the HAR file. Also, you can make Gatling to remember your preference and can be used next time by checking the Save Preferences button. Once you have done all the steps, click on the Start button to create the Gatling script.
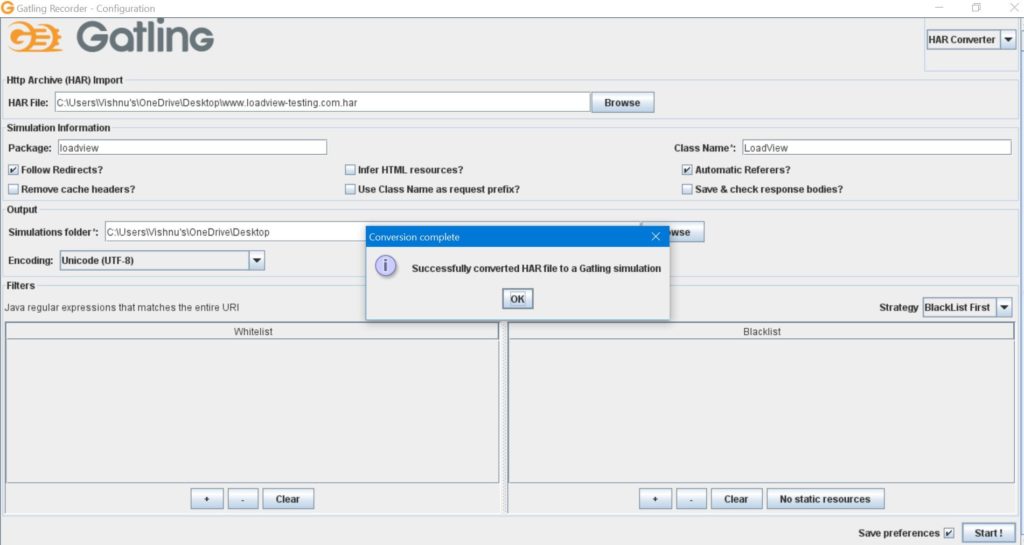
We will get a message that the HAR file is successfully converted into a Gatling simulation.
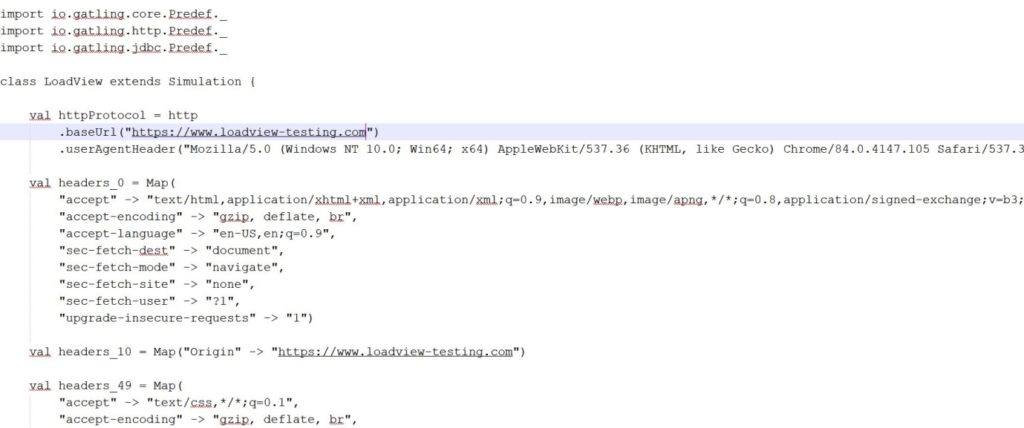
Gatling Simulation File
Let us now look at the Gatling simulation file generated. Browse the Gatling installation folder then go to User-Files and open the Simulations folder. This will be the default folder directory for the Gatling recorder. You can see your script with the Class name you have provided. You can see and open this file using any text editor, or by using any developer tool. For this purpose, we are using notepad++ to open and edit the script.
We have already gone through the steps for Gatling execution and report generation. Follow the same steps to execute a performance test using Gatling. Further script modification and simulation information can be learned through the Gatling setup documentation.
Gatling Tutorial Conclusion
So, as we have shown, there are a lot of steps, prerequisites, and additional downloads involved in the process. Don’t you think Gatling is more complex tool to use? If you are not from a programming background you will have tough time using Gatling. Do not worry, that is why we are also going to discuss the same process using the LoadView performance testing solution. LoadView is a cloud-based load testing solution that allows users to test their websites and applications in a shorter amount of time, without having to have a background in programming. In the following sections, we will show you a demo of LoadView, starting from scripting to report generation.
Load Testing Using LoadView
LoadView allows users to carry out all your performance tasks in cloud. You can do scripting, execution, and reporting all from the same interface. Isn’t that awesome! We will show, step-by-step, of the load testing process for the same site which we scripted using Gatling. Compared to the process with Gatling, we think you will see it is much more efficient and easier. You only need to script the user actions on the page using the built-in recorder and set up a load pattern. It is as simple as that!
Recording User Scenarios with the EveryStep Web Recorder
Again, the website we are going to test is LoadView, the same website we used for Gatling. If you do not have a LoadView account, sign up is fast and easy – and you will receive free load tests to get started with your first load tests.
Select Your Load Testing Type
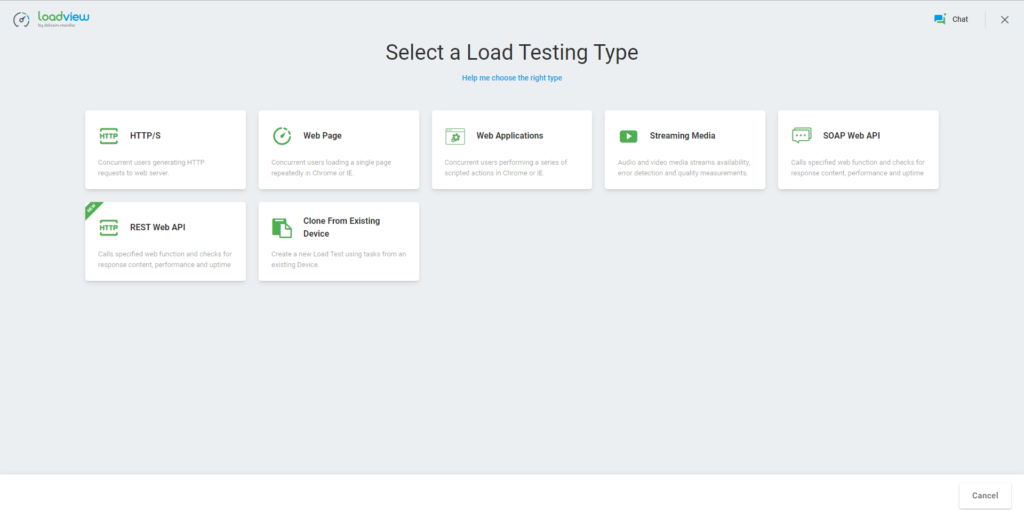
If you are already signed up, you can navigate to your account and access LoadView and the EveryStep Web Recorder. Or just open the recorder first and then log in to your account. Click on New Test and this will open the LoadView recorder window as shown below. Select Web Applications.
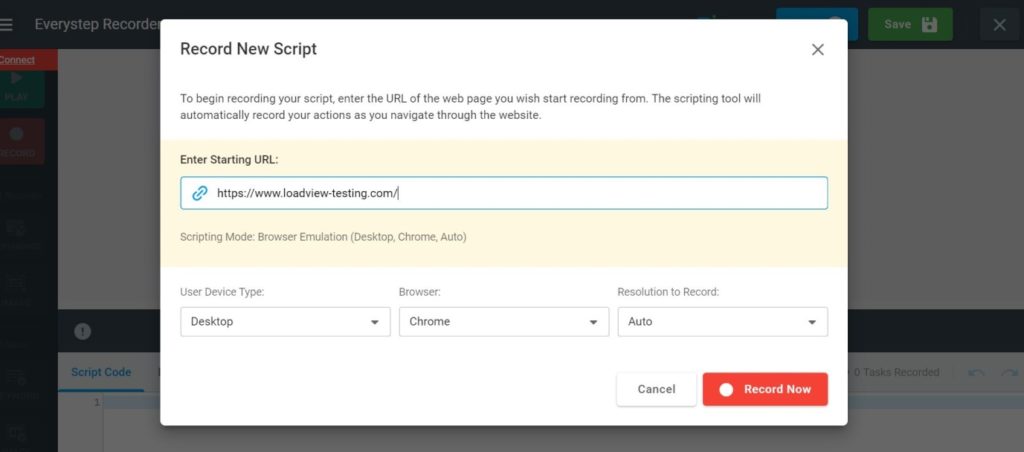
Once you click on Web Applications, it will start the EveryStep Web Recorder. You need to enter web application address, which again, will be the LoadView website (https://www.loadview-testing.com/).
Device Compatibility Considerations
You can also do performance-based device compatibility testing using LoadView. There may be a situation where you are facing issues only for your mobile devices. In that case you can select mobile/tab/laptop based on your application compatibility support.
Enter your URL and click the Record Now button.
Begin Recording with the EveryStep Web Recorder
The recording is now started. You just need to perform your specific steps/navigation on the screen. As you go through, you will see each step being recorded and entered below. Recorded script details are visible in the screen below the recorder.
End Your Recording
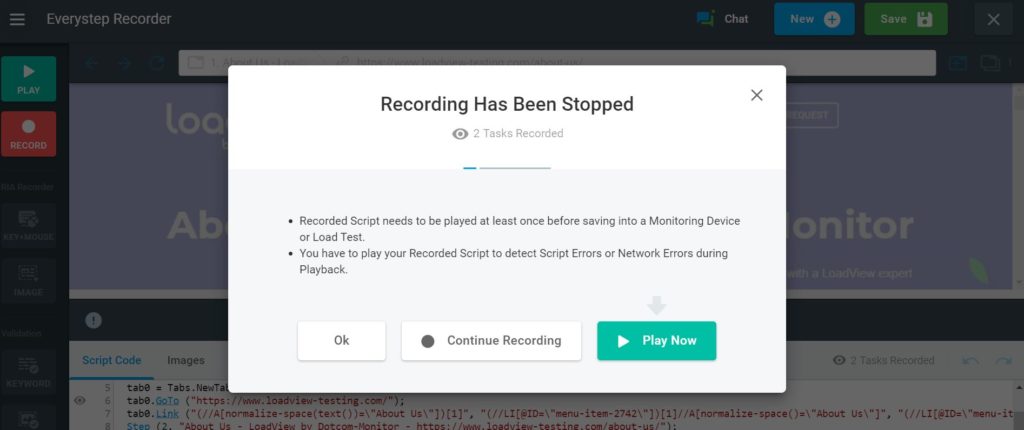
Once you have completed your use case scenario, click the Stop button. Next, will you need to click the Play Now button to replay the script. This will ensure that the script was recorded without any errors. If there are errors in the script, it will show the error message. If no errors occurred, it would show the success message. Save the script and modify later, if required.
Edit Your Scripts
Once you have completed and replayed the recording, you can further enhance the scripts based on the additional logic required. LoadView supports adding context parameters, delays, correlations, etc. Learn more about editing your LoadView scripts.
Setting Up Your Load Test
You will be prompted to create a new device to configuring your load test execution. Name your device and continue with setting up your device. There are a couple of additional fields to configure under Settings, Completion Timeout and DNS Options, if those are necessary for your goals. Read more about setting up your load tests. Once you are ready, you can select Create Device.
Configure Test Scenario
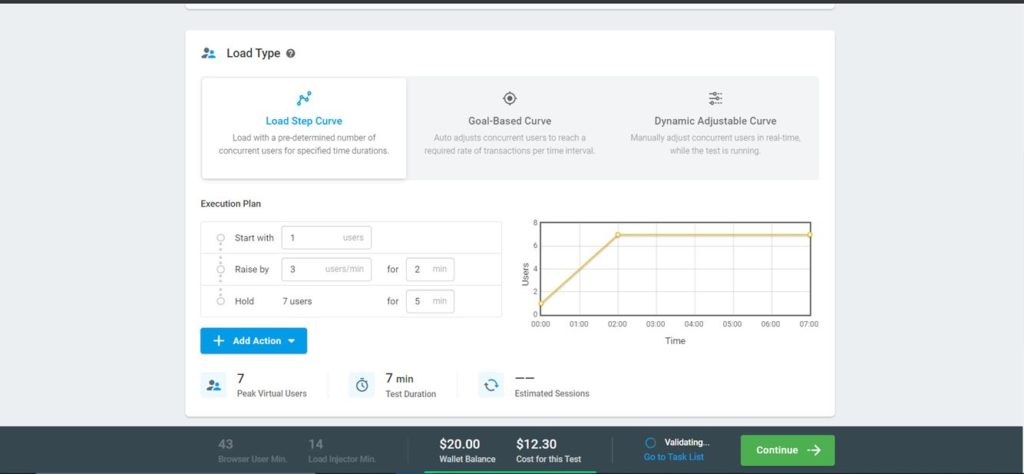
Choose any Load Type as per your requirement. There are a few different load curve options. Based on your performance workload model, you can decide your load type. We will go ahead with default settings and choose Load Step Curve.
Load Injector Geo-distribution
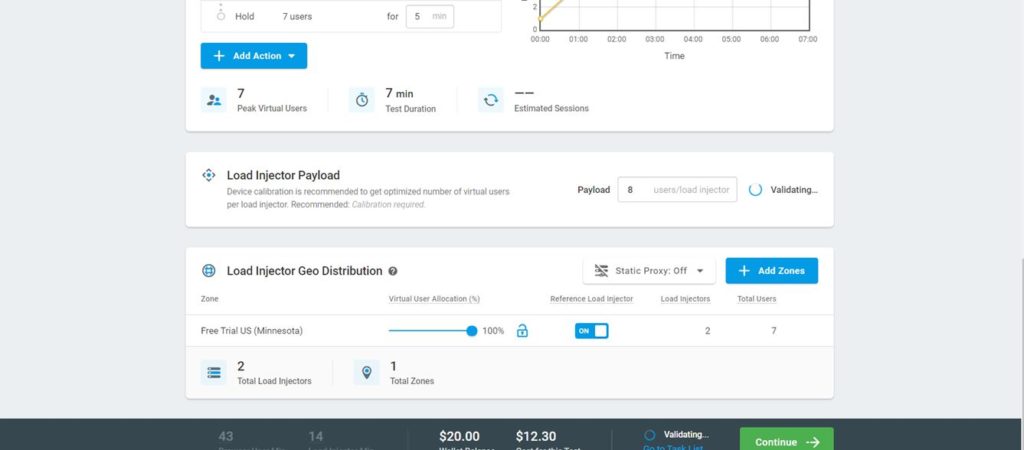
If you have a geographically dispersed customer base, LoadView allows you to choose from load generators located around the world. It is always good practice to generate your load from the country, or regions, where your website or applications are used the most. This one of the best features about LoadView. You will not get this kind of feature in most open-source performance testing tools out in the market today.
Finalize Your Load Test Details
Once you have created your workload model, next you need to provide your email address so that your load test report will be delivered to your email. You can also schedule your load test for later time. This will enable you to spend your time on other tasks. LoadView will automatically start the execution at your scheduled time and the reports will be delivered to the email address you provided.
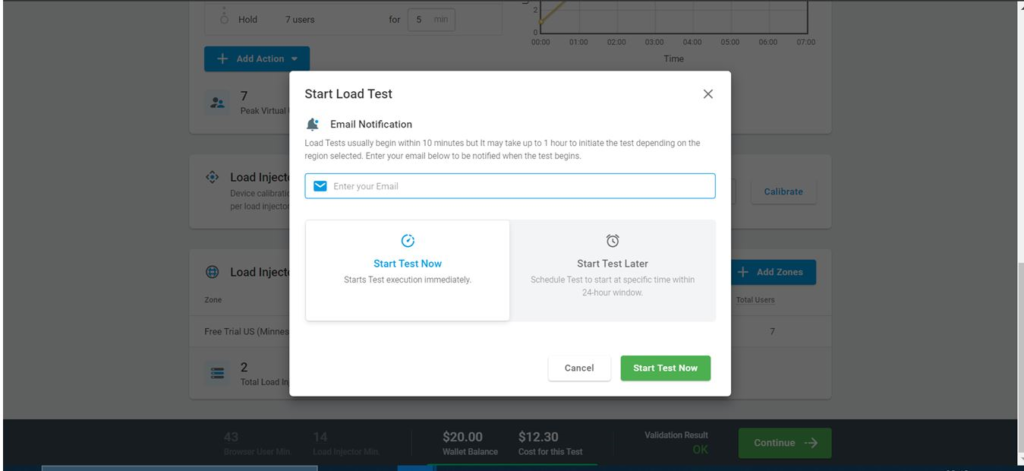
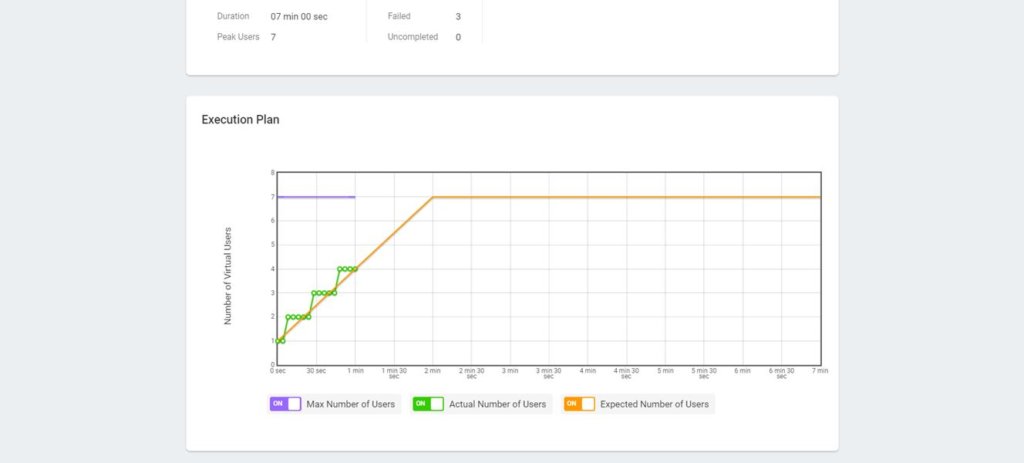
Start Your Load Test
Once everything is configured, click on the Start Test Now button. Once your load test execution has started, the status will be changed to Running. Give a few minutes for the load injectors to to start. You can view test summary tab for current load test status. Real-time load test graphical data will be available under the Execution Plan.
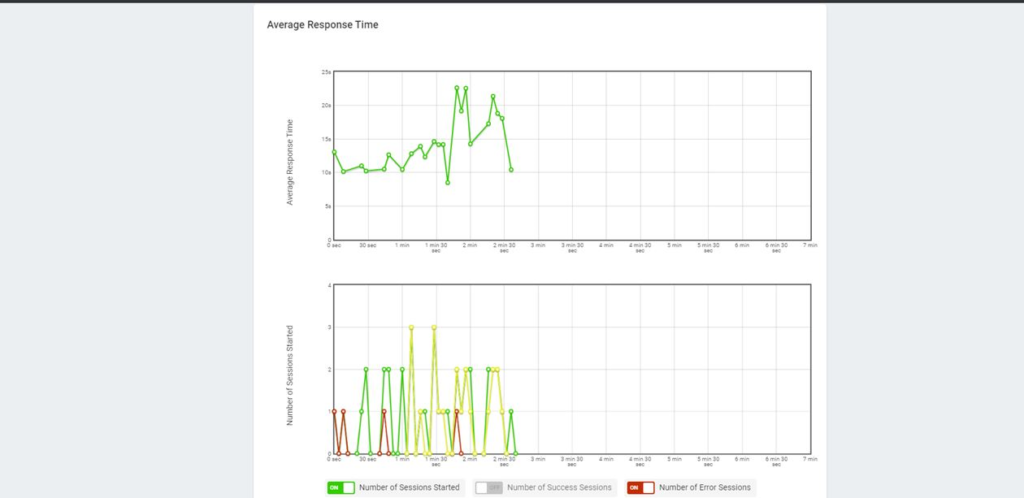
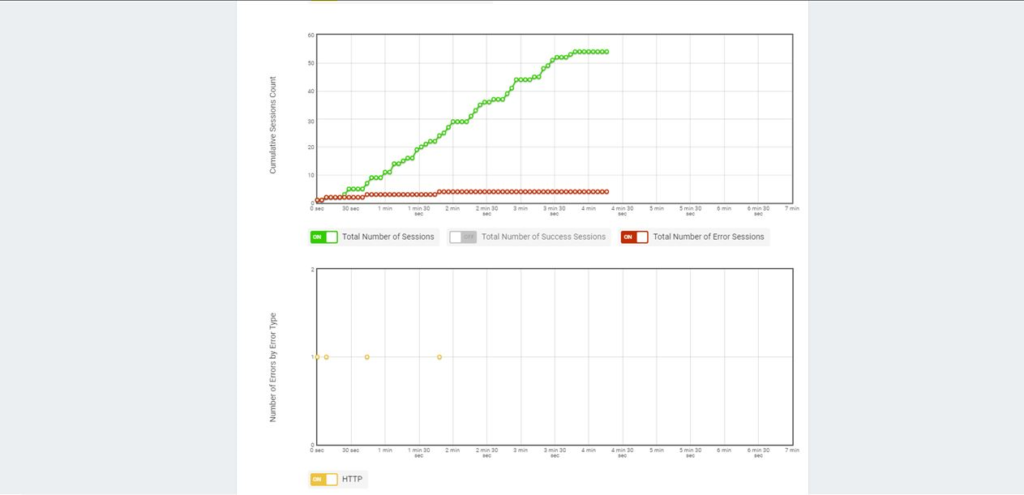
Cumulative Sessions & Errors
You can also observe additional graphs like total number of successful sessions and total number of errors by error type.
Load Test Report
After the test execution performance test report will be delivered to your email as a PDF attachment. You can also see that information from LoadView console. This can be shared with your team and various internal stakeholders.

And that is it. You have just performed a load test with LoadView. As you can see, it was very straightforward, and it just took a few clicks. And you didn’t need to do any complex coding or go through any time-consuming hardware setup and installs.
Gatling Load Testing: Wrap Up
If this was your first exposure to Gatling, I am sure you still have lot of questions, but you should have basic knowledge to consider using Gatling for your next project. Major advantages of Gatling is that it can generate so much load from a single machine, especially if you are running Gatling in a continuous integrated environment. The real power of Gatling comes from running in a CI/CD environment along with a tool like Jenkins. If you are really interested to learn advance level Gatling, I would suggest you learning Scala. And that may be too much of effort along with carrying out tests. Along with the tool, you need to learn a brand-new language. I do not think it is worth spending your time on learning a new language. Instead, you should be spending your valuable time on polishing up on your performance engineering skills.
This is where you can utilize the full potential of LoadView. You do not need to spend extra time on learning a new tool, a new programming language, or managing load generators, etc. Just log in to the platform, record your script, and execute the load test. You can spend your valuable time on optimizing and scaling your applications. If you run into any issues, the LoadView team also offers unparalleled 24/7 support. Performance engineers are standing by you to guide with the setups, scripting, and testing process if necessary. Start your LoadView trial today!
And if you are just beginning the process of researching performance testing tools, head over to our Load Testing Alternatives page where you can compare other load testing tools and platforms, such as BlazeMeter, k6, Flood.io, LoadRunner, etc., to LoadView.