React.js, colloquially known as just React, is an open-source JavaScript library published and maintained by Facebook used to build dynamic user interfaces for single-page applications (SPAs) and modern web applications. It is a lightweight front-end library capable of handling client-side operations of websites and mobile applications. Jordan Walke designed the tool while being a software engineer at Facebook. He got inspiration from XHP, an HTML component library for PHP. The library was first released as FaxJS in 2011 on Facebook’s News Feed, but was not deployed as an open-source framework until May 2013.
The main purpose of React is to be easy to use, fast to develop web applications with, and scalable over time. It builds an in-memory representation of the web browser’s DOM (Document Object Model) to manage front-end operations. This allows developers to design views for every state in their applications while it efficiently renders reusable UI (User Interface) components with updated data every time there is a change. Since React operates on a virtual DOM, it manipulates data changes much faster than if it accessed the browser’s DOM directly.
Nonetheless, despite the clever techniques React must reduce the amount of heavy DOM operations to quicken component rendering, in most cases, it will not be enough to optimize application performance. Developers must take a step further to guarantee modern day expectations by using adequate practices and reliable monitoring tools.
Why does Load Testing Applications Matter?
The success of today’s websites and web applications is significantly influenced by how clean and smooth their user experience is. Modern apps live in an extremely competitive market where only those who can efficiently reduce their load time and optimize their performance can retain an increase in user engagement.
Slow applications may be victims of poor coding, resource bottlenecks, and ultimately, poor planning and maintenance. Therefore, it is vitally important for developers to conduct performance tests and constant monitoring on their applications to determine which area of their system’s architecture needs attention and take the adequate actions to mitigate the issue. Addressing the issue efficiently will result in offering users a smoother user experience. Without performing load tests prior to launching a web application, you really have no idea how that web application is going to perform for users once in the wild. Even if you have put the web application through its paces during the functional testing, or black box testing phase, those functions need to be tested under normal and peak traffic conditions to ensure response times remain within your performance thresholds and to understand how your system handles visitor load.
Native Tools to Improve Load Times
React Developer Tools
The React Developer Tools is a developer extension available for Chrome, Firefox, and as a standalone app that allows developers to inspect a React application’s component hierarchy and record performance information. The extension offers a profiler plugin that consumes React’s Profiler API to gather information about every component rendered in the application and committed to the DOM in order to diagnose performance issues. Then, the Profiler groups these commits to show performance info.
Developers can filter their web app’s commits from a session among various charts that represent performance data. These charts can filter the recorded performance data by components, by interactions and by rendering time.
Using React’s Perf
Perf is React’s code-based profiling tool. It is an add-on library development teams can use to diagnose the overall performance of their applications. It is used to log measures like mount and render time of specific components. The library consists of three main methods to collect data and six others to print it to the console. The start() and stop() methods determine the beginning and the end of the performance session. All operations done in between are recorded and measured. The react-addons-perf tool is no longer supported from React 16 onwards.
Chrome Development Tools
Chrome Development Tools are a set of web developer utilities that help engineers and developers from all web development technologies quickly edit web pages and visualize its changes, and fix issues that occur during runtime to build better websites. For React applications, the Performance section helps distinguish which components are loading and how long rendering times are impacted.
Like the React Profiling extension, The Performance tab records the application performance from a specific spot determined by the development team. After the page loads completely or the performance recording is stopped, the data is published to the User Timing API to help React developers see the load times for the individual elements, along with JavaScript function calls, which are used to determine which components to diagnose for better load times.
LoadView Approach to Optimizing React App Performance
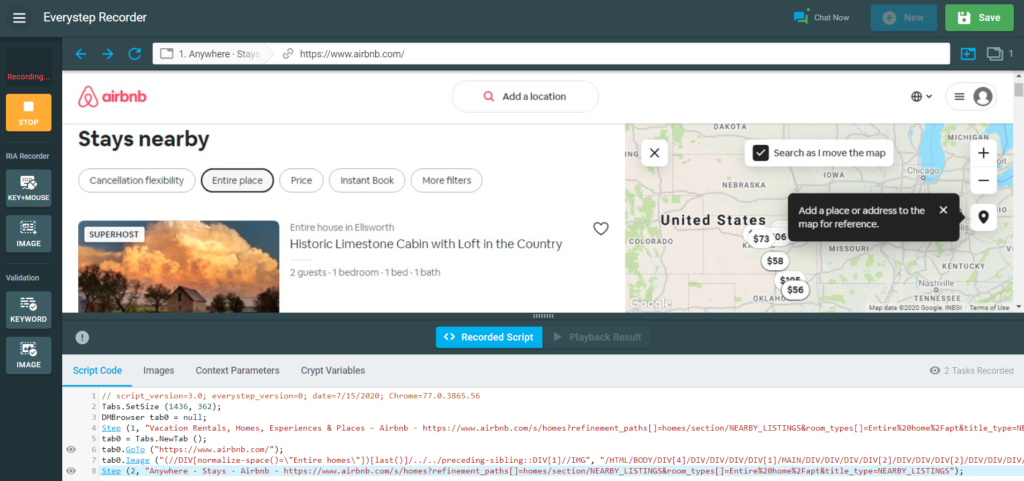
LoadView takes web app testing to the next level by utilizing the EveryStep Web Recorder, a powerful scripting tool that simulates client-side operations with websites and web applications to test complex user paths and scenarios. The EveryStep Web Recorder can capture complex interactions like mouse clicks, hovers, and movements, on-page image and text validation, menu selections, and much more. Moreover, testers can load custom data to simulate the same actions from multiple users such as account logins, sorting and filtering information, or test dynamic behaviors. Developers can dive deeper into the tests and manually edit the performance script using C# to automate the execution of repetitive tasks within then application.

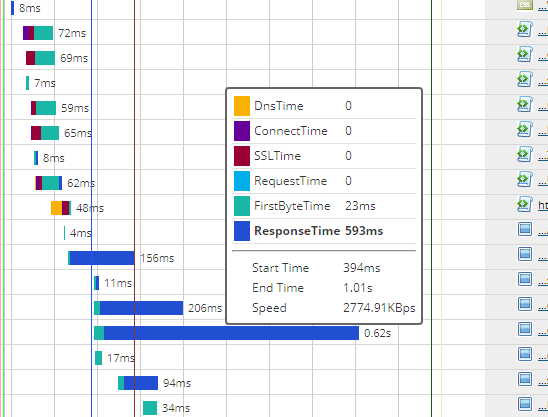
The LoadView solution offers React Developers the capacity to inspect web app component rendering times, even those not perceived by the user. Furthermore, waterfall charts and performance reports capture overlooked interactions in the DOM.

Load Testing Applications Written in React.js: Conclusion
React is one of today’s most on-demand front-end development tools. Its component-based development structure reduces development time and proposes the chance for developers to reuse code in an efficient manner. However, it is not enough to rely on the library’s fast execution time. Development teams must use performance monitoring tools, like React DevTools, to successfully identify performance issues and take proper actions to optimize their applications, and the LoadView EveryStep Web Recorder to accurately replicate user paths and scenarios to diagnose hidden bottlenecks that can potentially be slowing web app response time and deteriorating the user experience. You can try the EveryStep Web Recorder right now to start scripting user actions within your React applications and upload them for load testing within the LoadView platform.
Sign up for the LoadView free trial and get up to 5 free load tests to get started today!
And don’t forget that once you put your React web application into the live, production environment and it is front of large numbers of users, we recommend to setting up ongoing monitoring with the Web Application monitoring solution from Dotcom-Monitor. The LoadView solution shares the same interface as the Dotcom-Monitor platform, so the scripts that you created with the EveryStep Web Recorder can be uploaded to the Web Application monitoring solution. Ensure your React web application is always available and functioning. If errors occur, or performance thresholds aren’t met, you get alerted immediately, so you can take immediate corrective actions.